Open Tracing
In Bronto, select Tracing from the left navigation.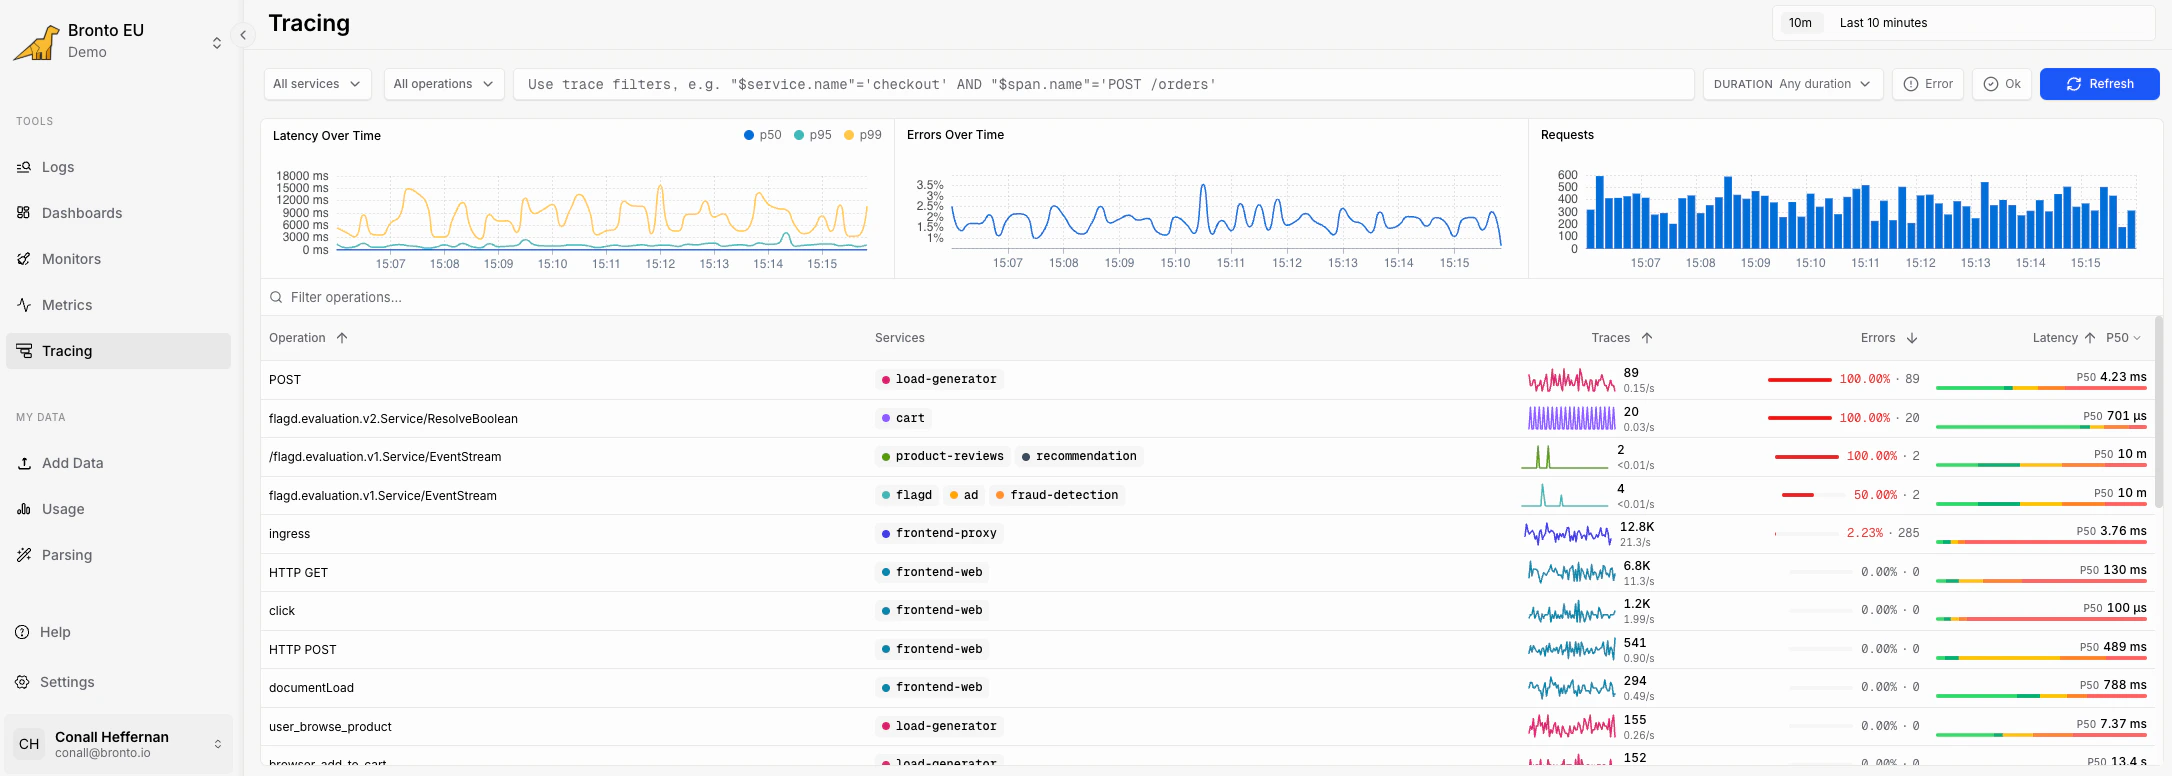
- filters for services, operations, SQL conditions, duration, and time range
- summary charts for latency, errors, and request volume
- a table of operations with trace count, error rate, latency, and recent activity
Filter traces
Use the filters at the top of the page to narrow the operations shown in the table.
The Services and Operations filters support multiple selections, so you can compare related services or focus on a single endpoint.
Read the overview charts
The charts above the table summarize the currently selected trace set.
Use these charts to spot spikes before drilling into the operation table. For example, a latency spike with steady request volume usually points to slow dependencies, while an error spike may point to a failing route or backend service.
Use status filters
The Tracing page includes quick controls for common status views:- Error narrows the view to failing traces.
- OK narrows the view to successful traces.
Search operations
Use Filter operations above the table to quickly find an operation by name. This is useful when a service emits many operations and you already know the route, RPC method, or job name you want to inspect.Read the operation table
The operation table groups trace activity by operation.
Sort the table by trace count, errors, or latency to find the busiest, most broken, or slowest operations first.
Drill into traces
Select an operation row to open the traces behind it. From a trace detail view, use the available trace and span context to inspect timing, errors, attributes, and related logs. This is where you move from “which operation is slow or failing?” to “which span or dependency caused it?”Common investigation flows
Find a slow endpoint- Set the time range to the period where users reported slowness.
- Use the Services filter to choose the affected service.
- Sort by latency.
- Open the slow operation and inspect the longest traces.
- Select the Error filter.
- Sort the table by error rate.
- Open an operation with a high error percentage.
- Inspect failing spans and related logs.
- Select multiple services from the Services filter.
- Use the operation table to compare trace volume, error rate, and latency.
- Use SQL filters to narrow the comparison to a method, status, customer, or other indexed field.