Overview
Bronto gives you the ability to create monitors that actively run searches across your data and notify your teams via email or custom webhooks.Create Monitors
To create monitors in Bronto:Apply a filter using Bronto’s search syntax. For details, see Search Syntax.
Add Queries and Formulas
Use + Add Query and + Add Formula to build a monitor from more than one query result. Each query has a name, such aserrors or requests, which you can reference in a formula.
If a monitor includes more than one query, add a formula to combine the query results before configuring the alert condition.
Add a Query
Select + Add Query to add another independently configured query to the monitor. The new query can use a different scope, filter, aggregation, or grouping from the first query. For example, to prepare a monitor that tracks the HTTP error rate:- Configure query
errorsto count requests with a status code of500or higher. - Select + Add Query.
- Configure query
requeststo count all requests.
errors and the total request count in requests.
Add a Formula
Select + Add Formula to calculate a value from numbers, query results, or a combination of both. Reference a query by entering its query name in the formula. Formulas support:- Parentheses:
(and) - Addition, subtraction, multiplication, and division:
+,-,*, and/ - Numerical constants, including decimals, such as
100,5, or1.5 - Variables that match the names of queries in the monitor
+ and - as unary operators to explicitly set the sign of a value. For example, errors + -5, -requests + 1000, and errors + +requests are valid formulas.
Continuing the HTTP error-rate example:
- Select + Add Formula.
- Enter
errors / requests * 100to calculate the percentage of requests that returned server errors. - Configure the alert condition against the formula result. For example, trigger the monitor when the error rate is above
5.
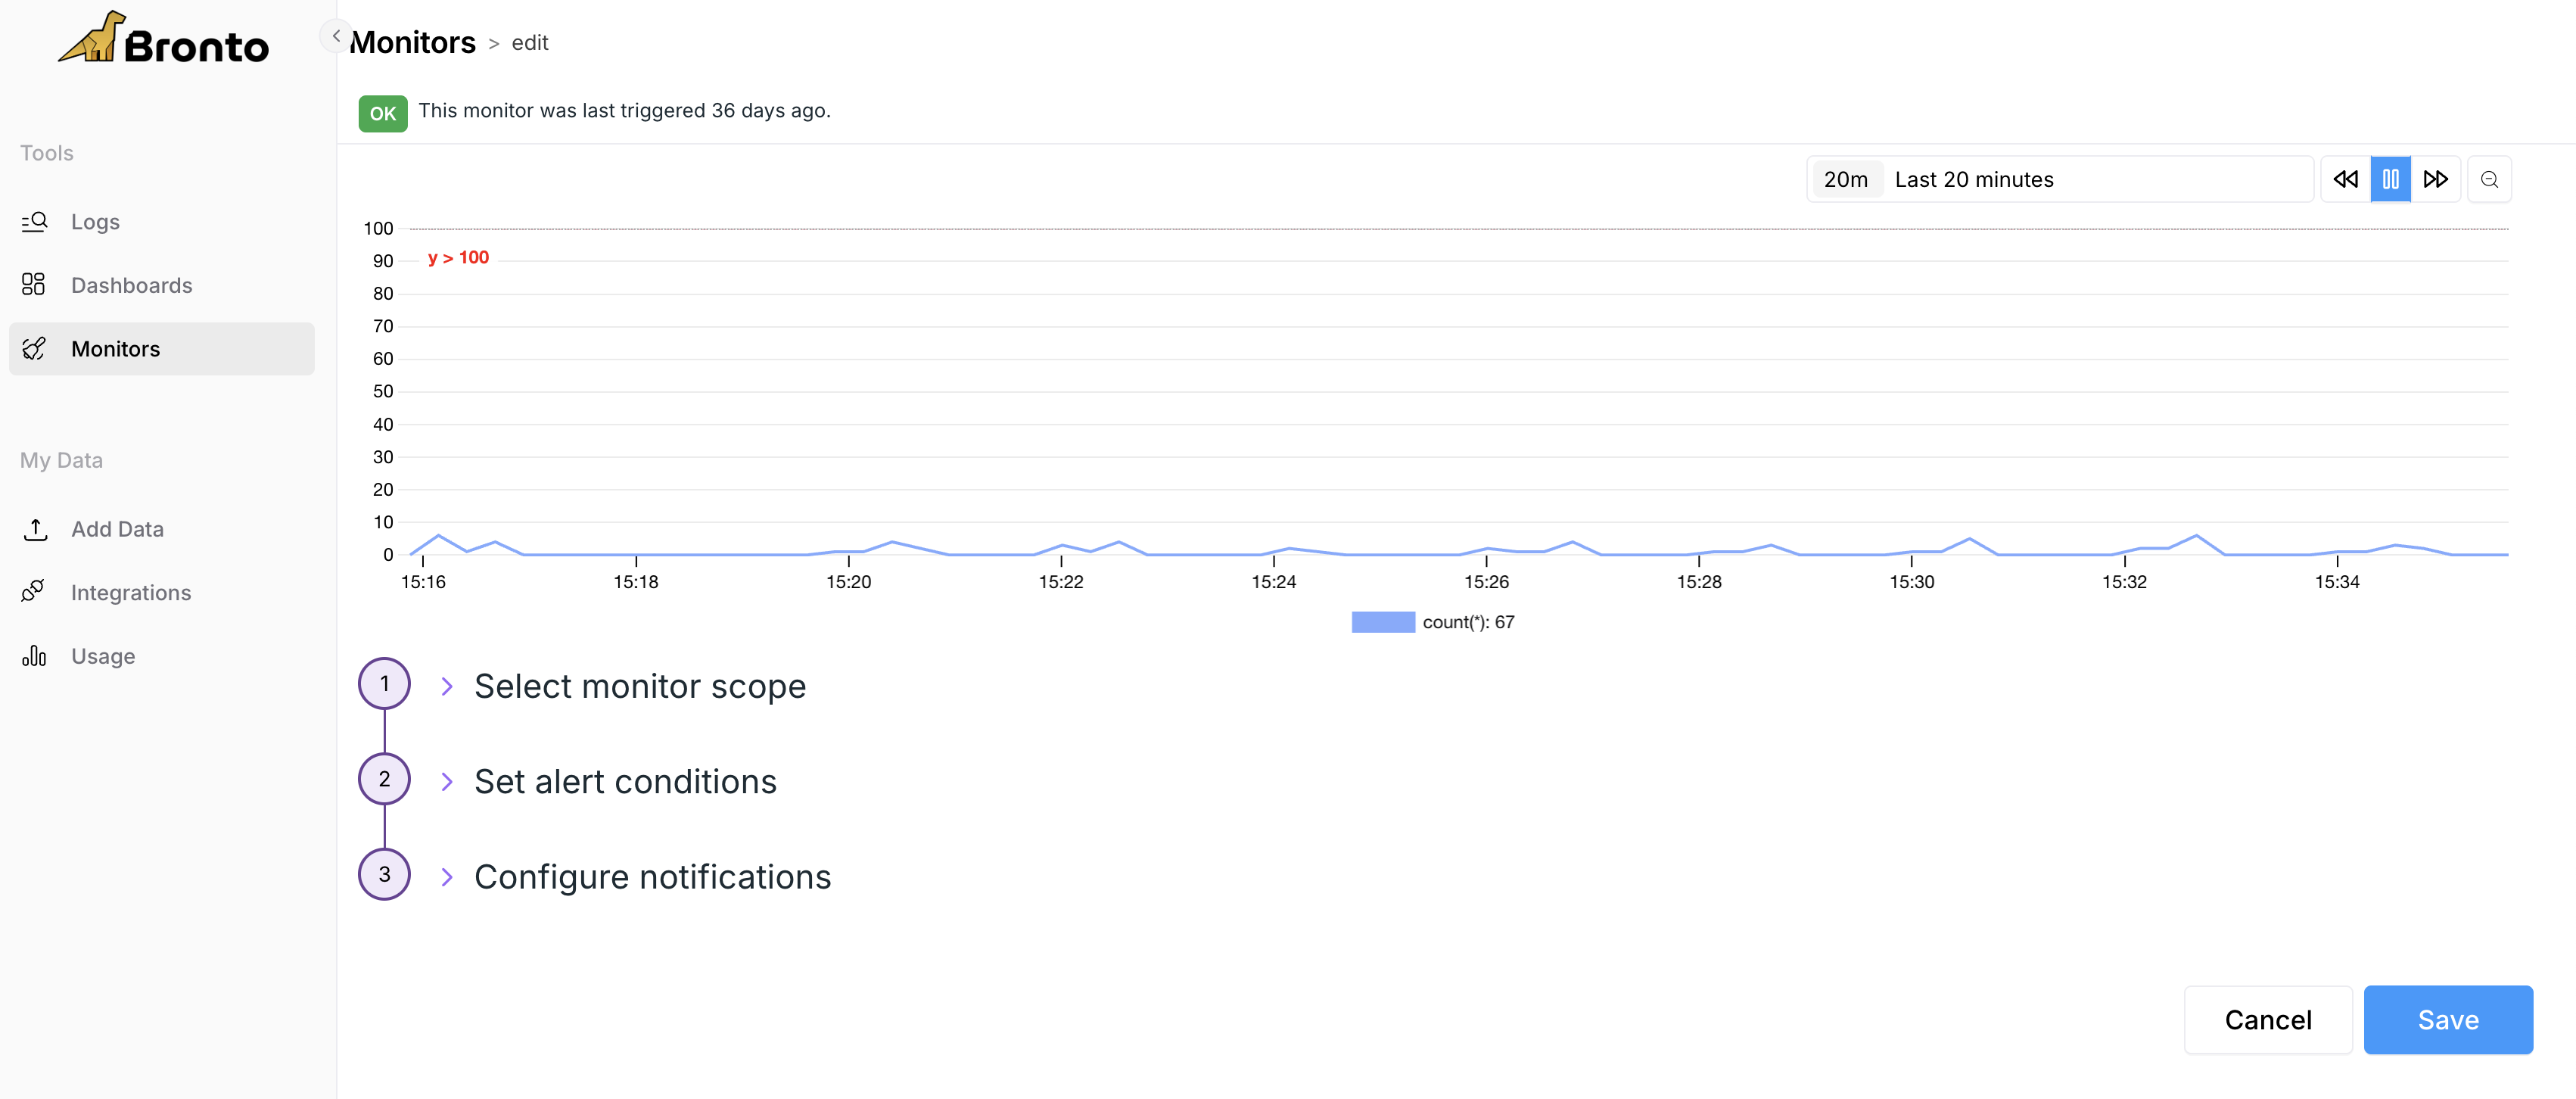
Setting Alert Conditions
The alert conditions can be configured to trigger if the count of the query reaches a predefind threshold.- Evaluate the query count over the last: 5 minutes, 10 minutes, 30 minutes, 1 hour, 2 hours, 4 hours or 1 day. Evaluation is across a rolling time window in groups aligned from midnight.
- Evaluate if query is above, above or equal to, below, or below or equal to the threshold.
- Trigger if Alert Threshold literal value is matched.
Configure notifications
Configure your notification messages to include the information you are most interested in and specify which user, email or webhook to send these alerts to.- Monitor Name.
- Monitor Description.
- View a preview of what the notification will look like.
Manage Monitors
Manage Monitors by editing, creating, bulk deleting and searching monitors all in the same place. From here you can easily view what email or webhook is associated to each monitor.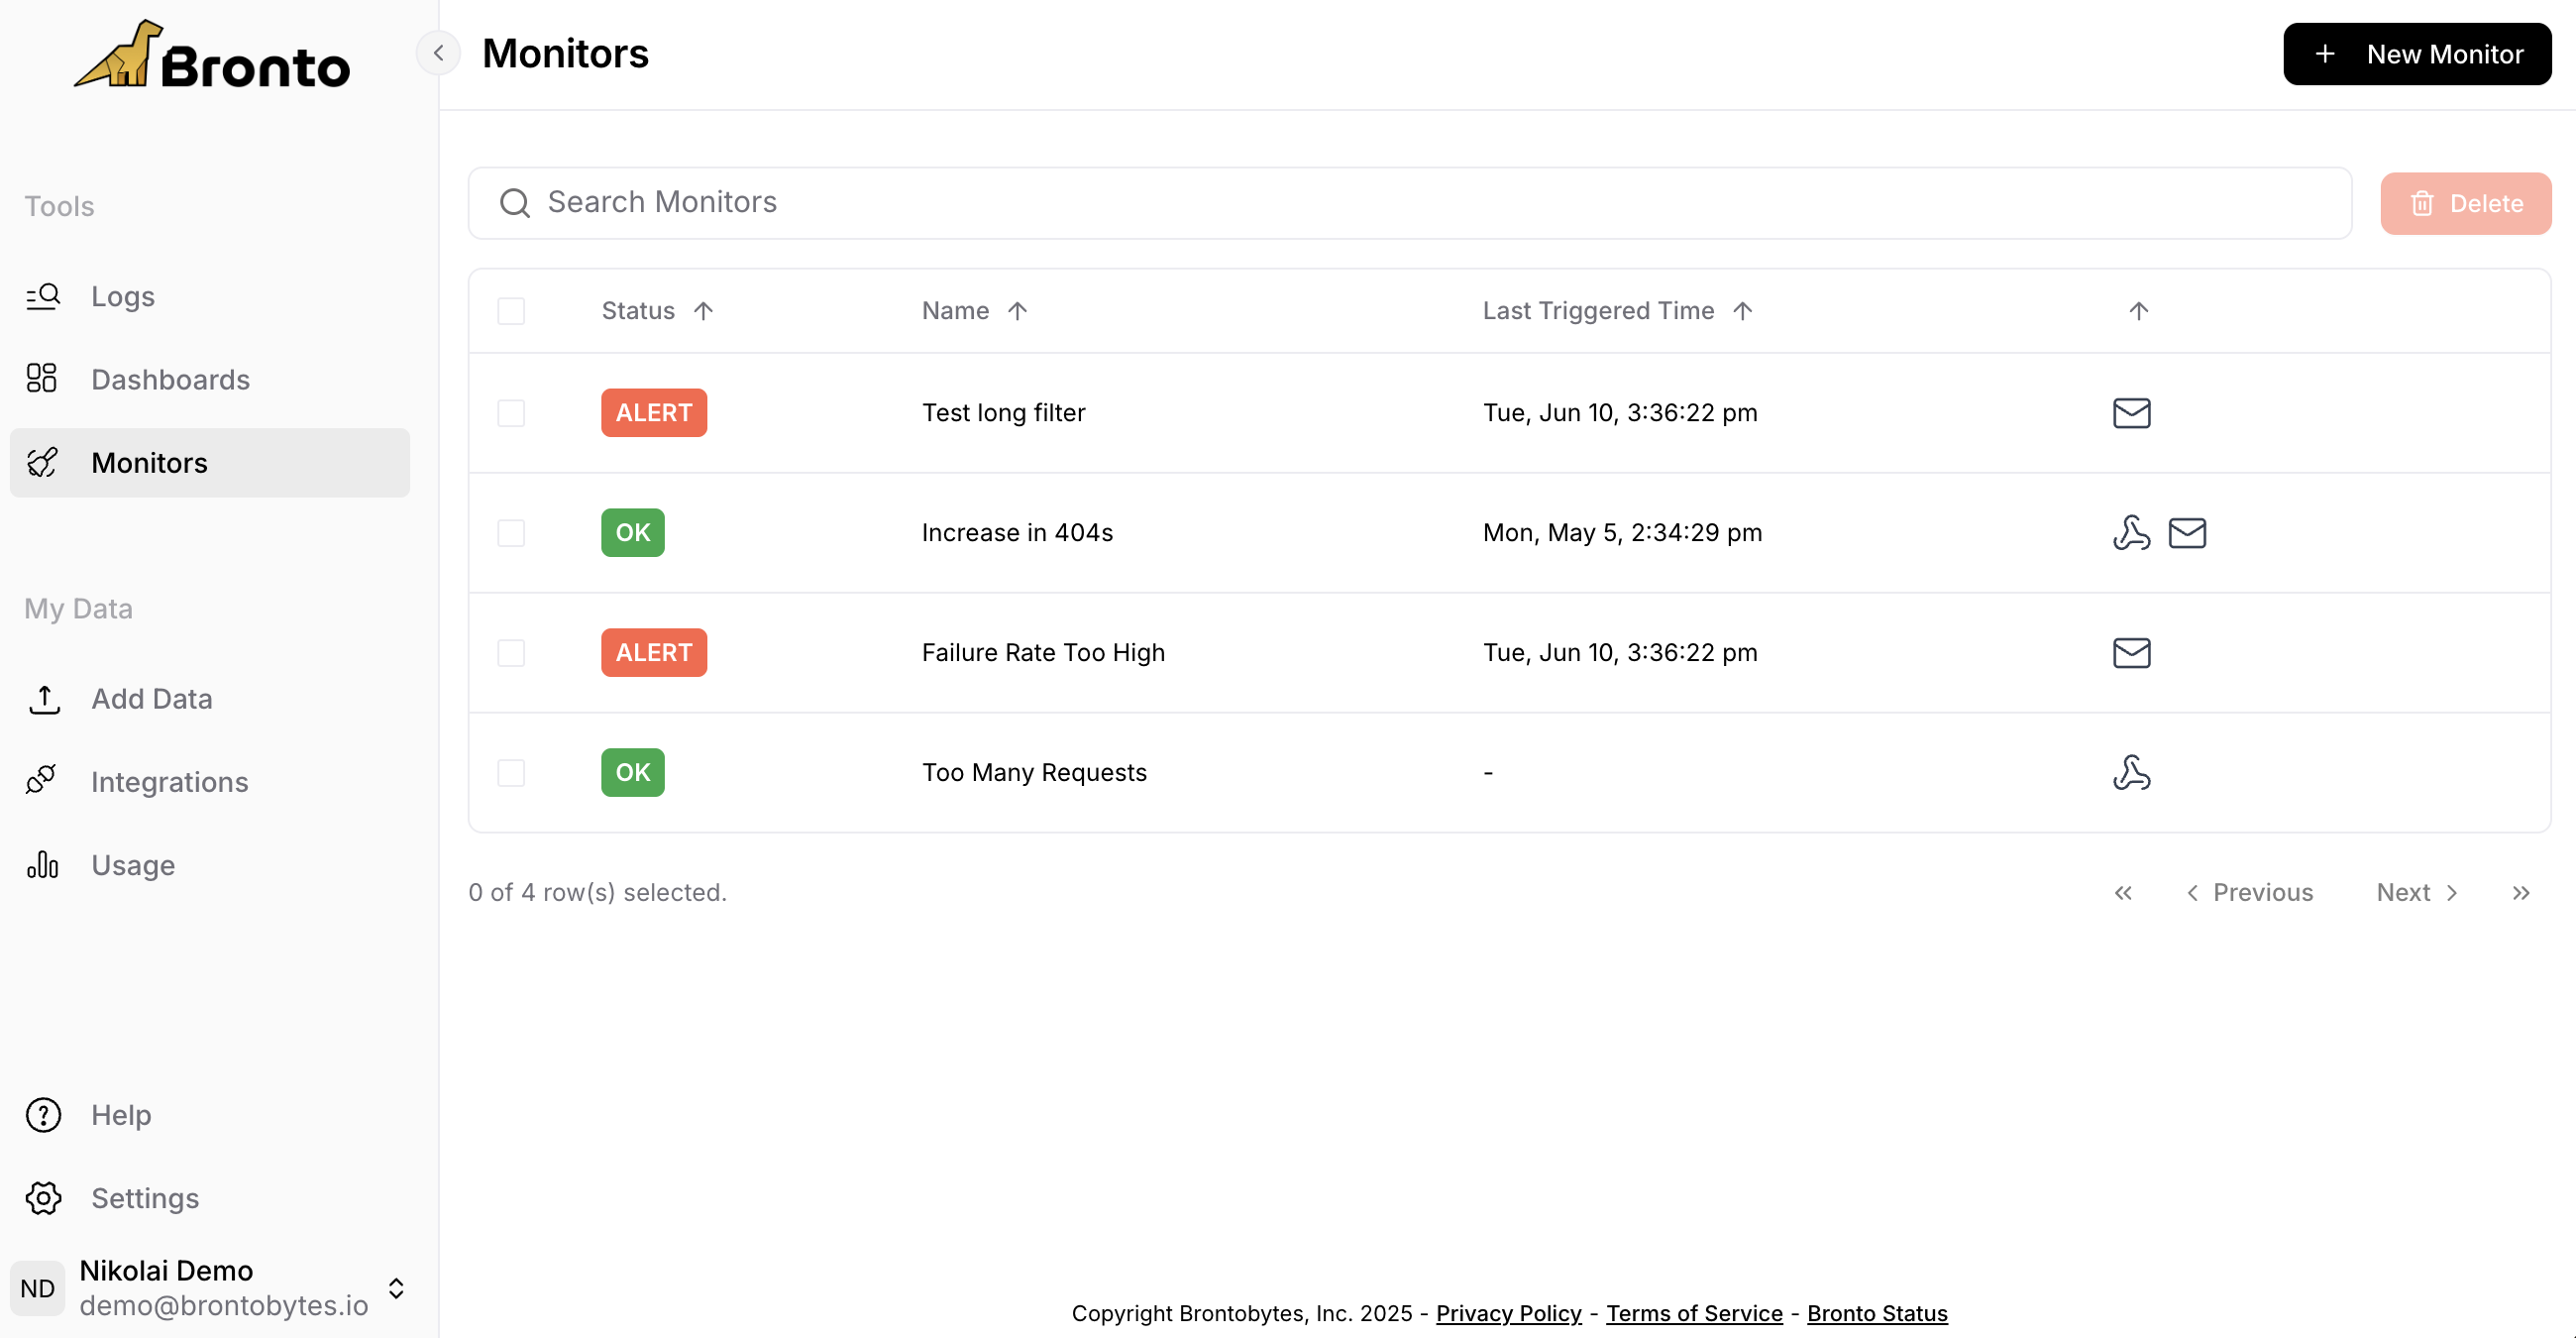
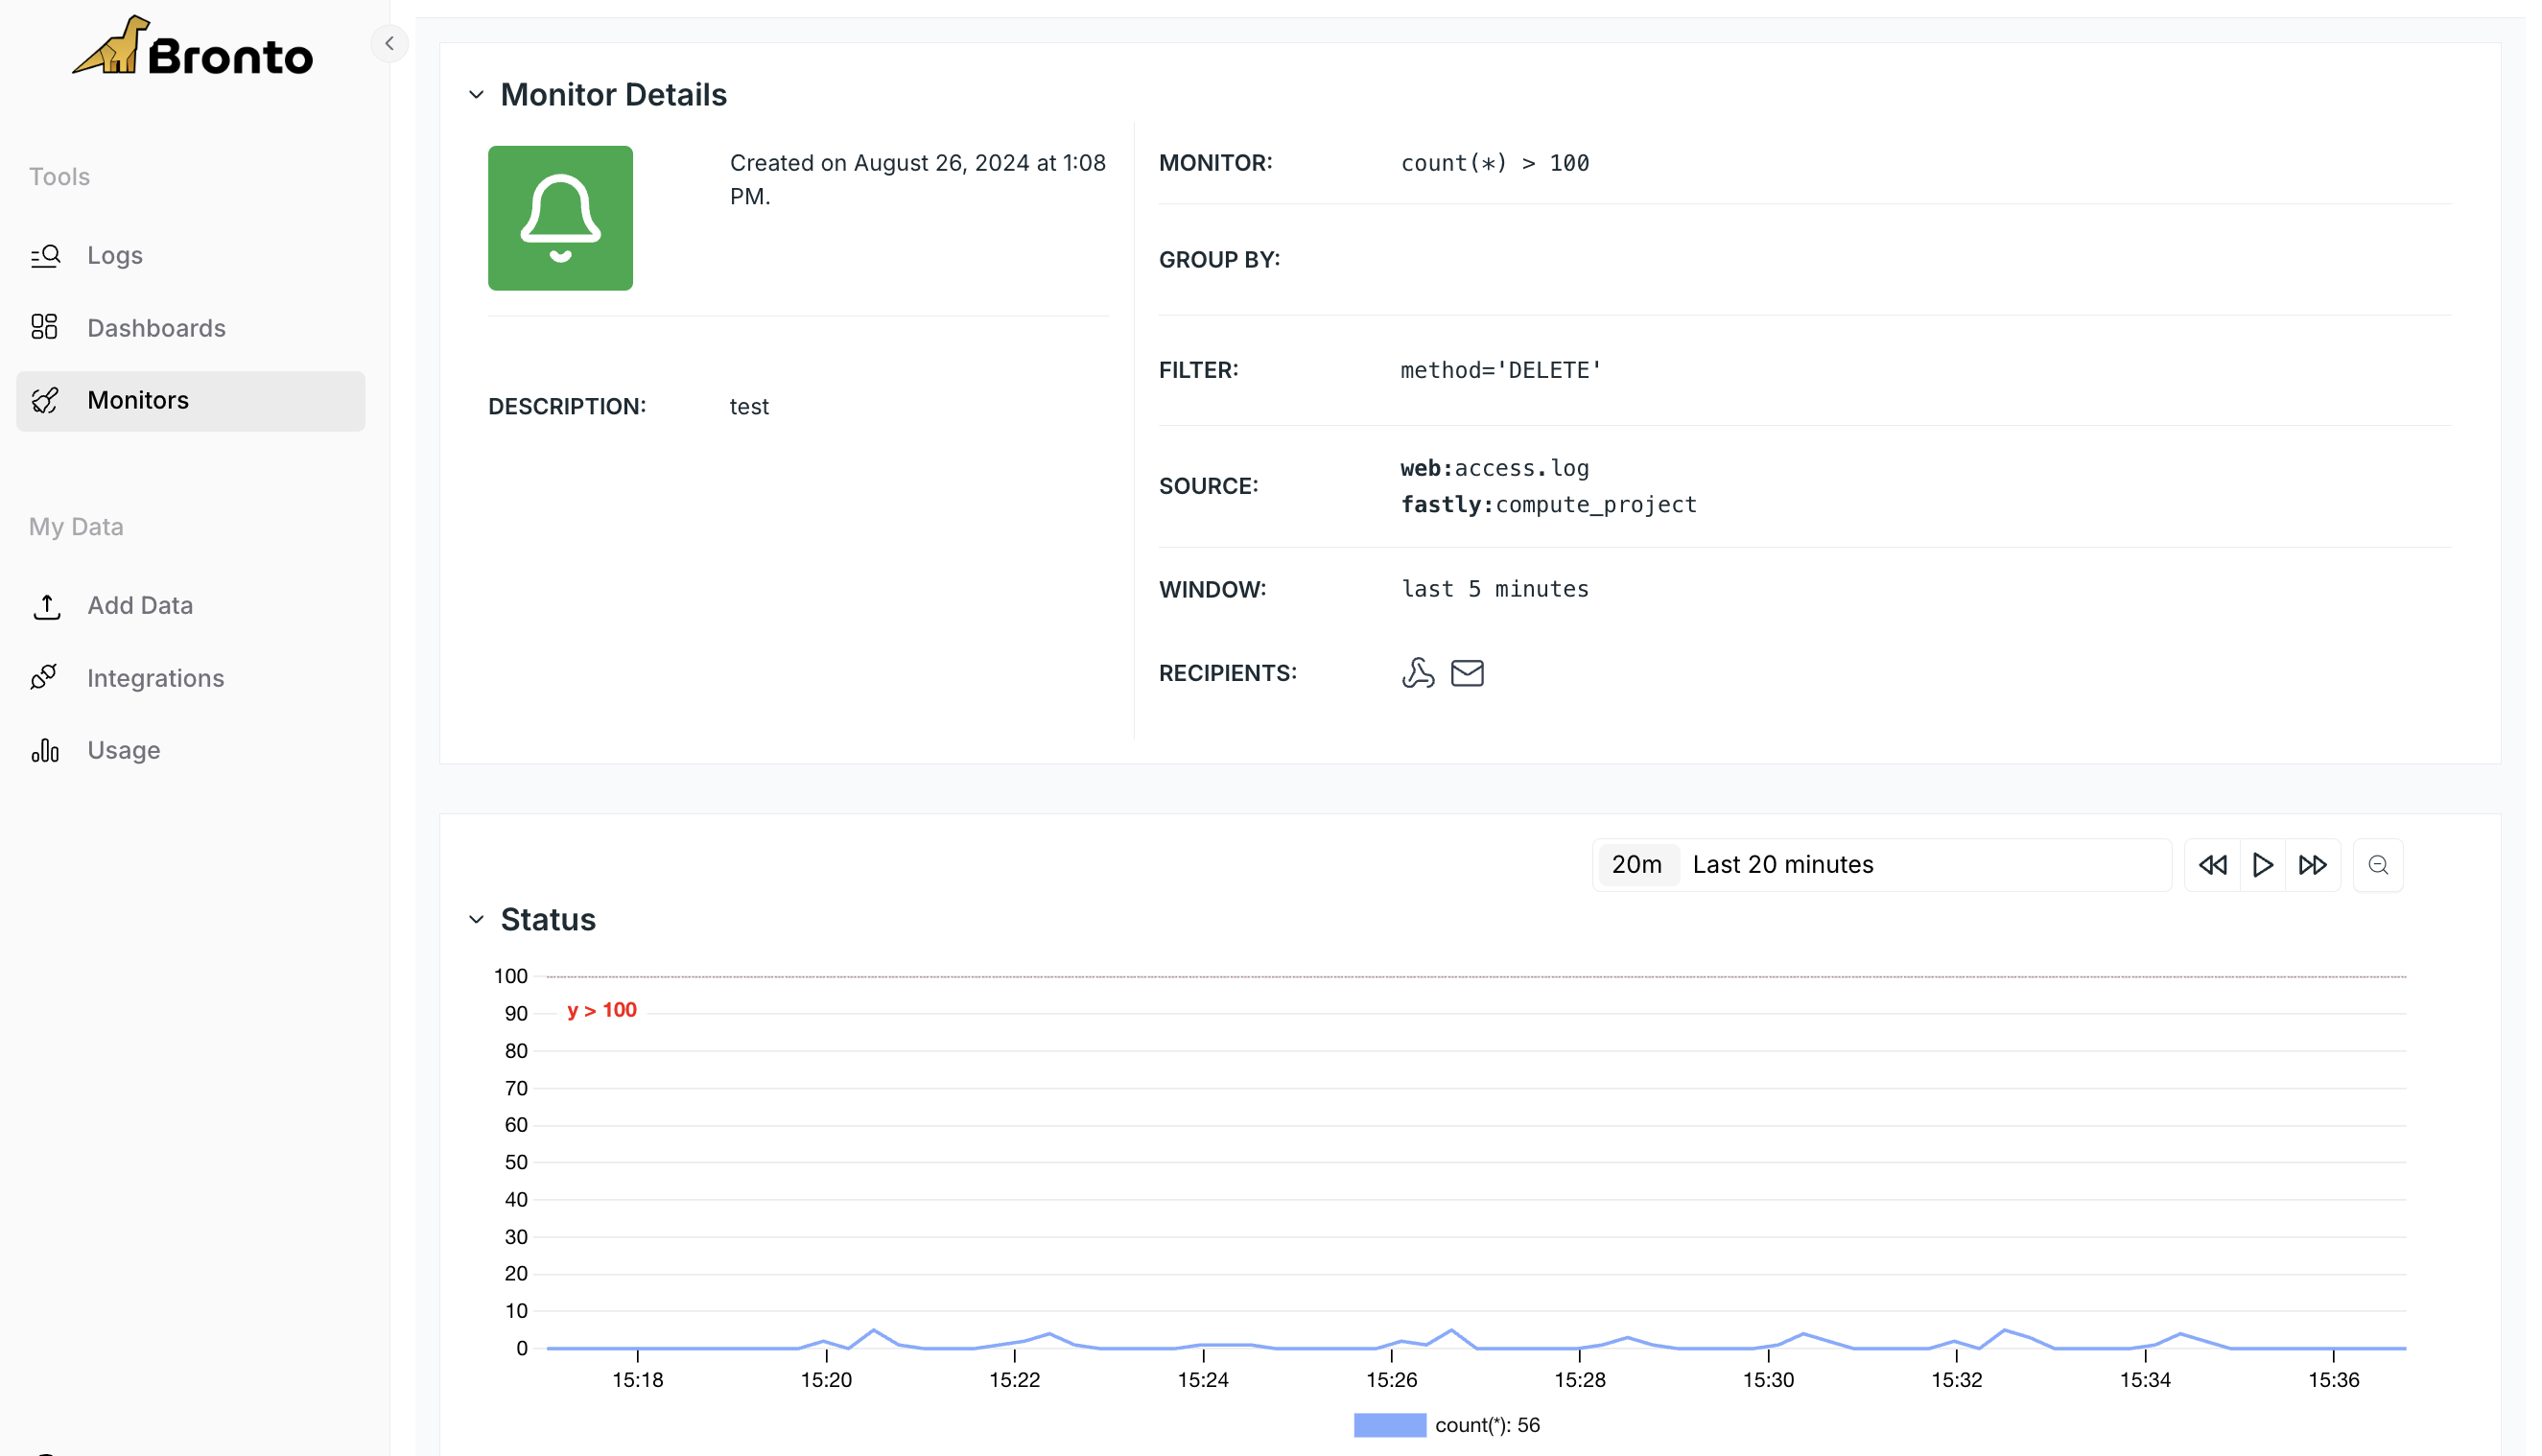
View Monitor Details & Status
Selecting a monitor to review from your list allows you to see its details which include its filter, source and recipients. From this page you can also view the status and event history