Overview
To start searching logs, click on the “Logs” item in the application sidebar.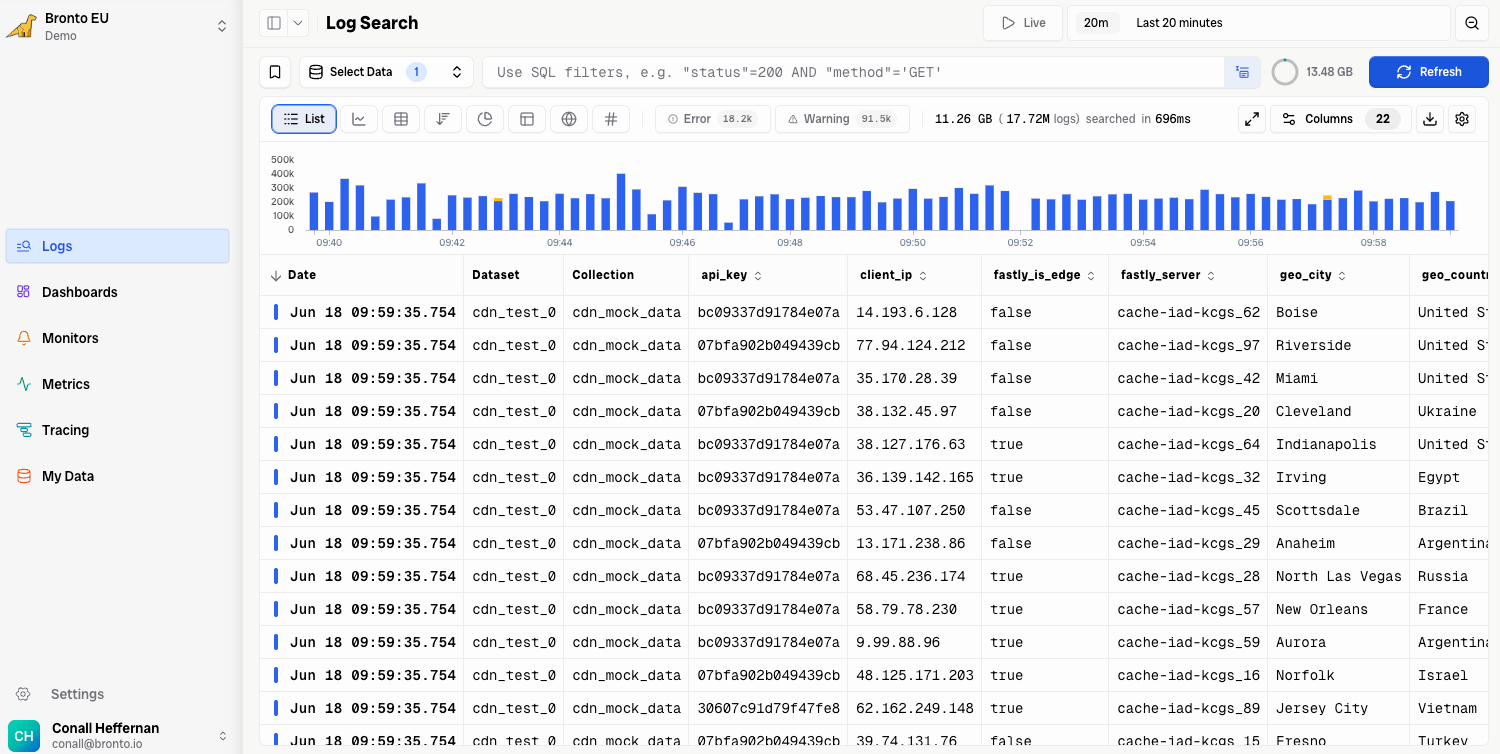
- Select the logs you wish to search from the log selector on the left side of the page. One or more logs maybe selected.
- Select the time range to execute your search on.
- Enter a search query in the search bar to filter results, or leave it empty to return all log events. Learn more about our search syntax here.
Search Result
Timeline
A time series showing where the results fall across the search time range is displayed immediately below the search bar.
Event Results
The log entries returned by the search are displayed in tabular format below the summary. The table has a column for each field that was configured in the fields textbox, by default all fields are shown. Clicking on any row in the table opens a sliding panel which displays various tabs related to the event which include Event Attributes, Resource Attributes and the Raw Event. From this pane you can can use keyboard arrows to view previous/next event.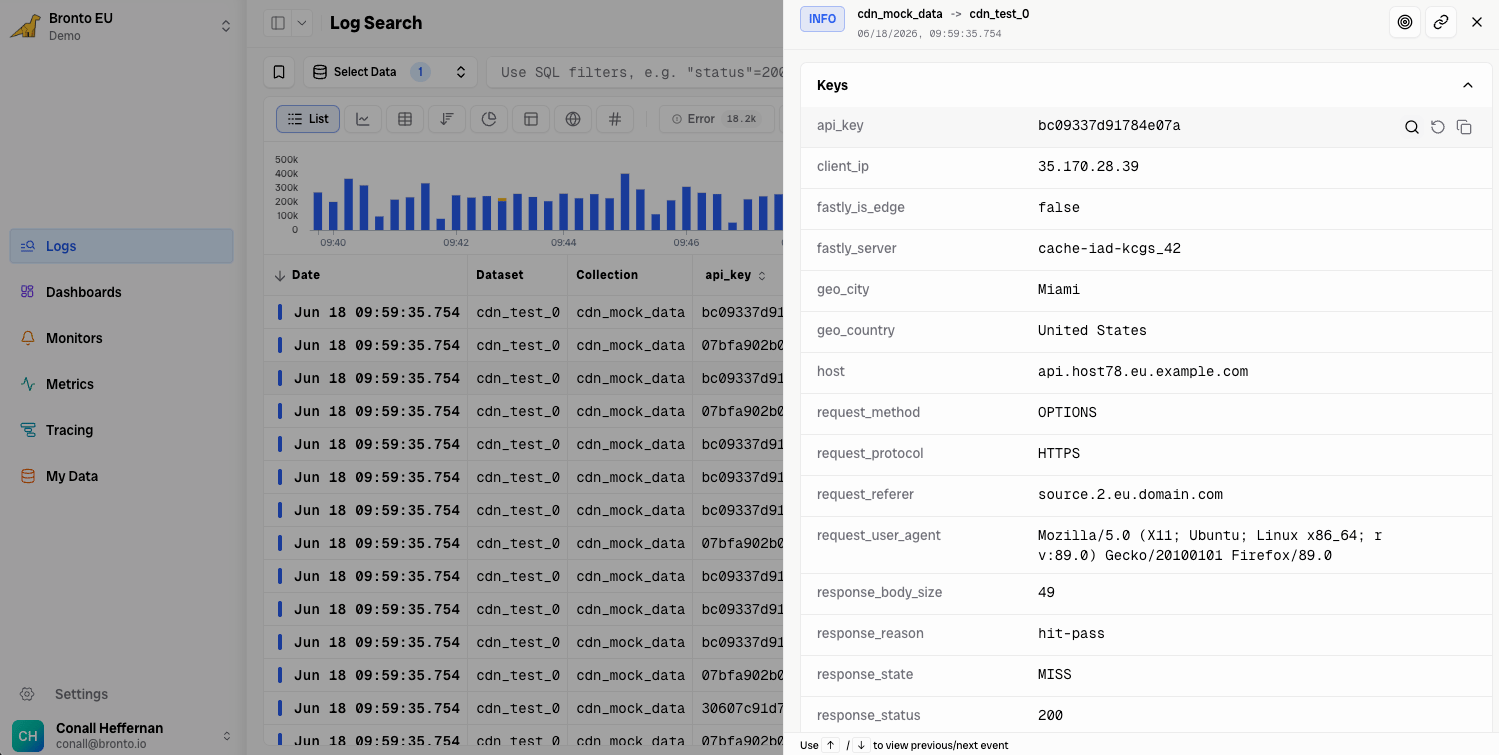
Click-to-filter from table cells
Click a value in a List or Table view cell to quickly refine your results. Select Add Filter to add the field and value to your current query, or Replace Filter to replace the current query with that condition.View Context
Use View context on an event to open a context view centered on the selected log entry. This lets you inspect the events immediately before and after the selected event so you can understand what happened around it without rebuilding the search manually. In the context view, Bronto keeps the selected event as the anchor and loads surrounding events in chronological order. You can also jump back to the original context event from the context view header.Time Series Results
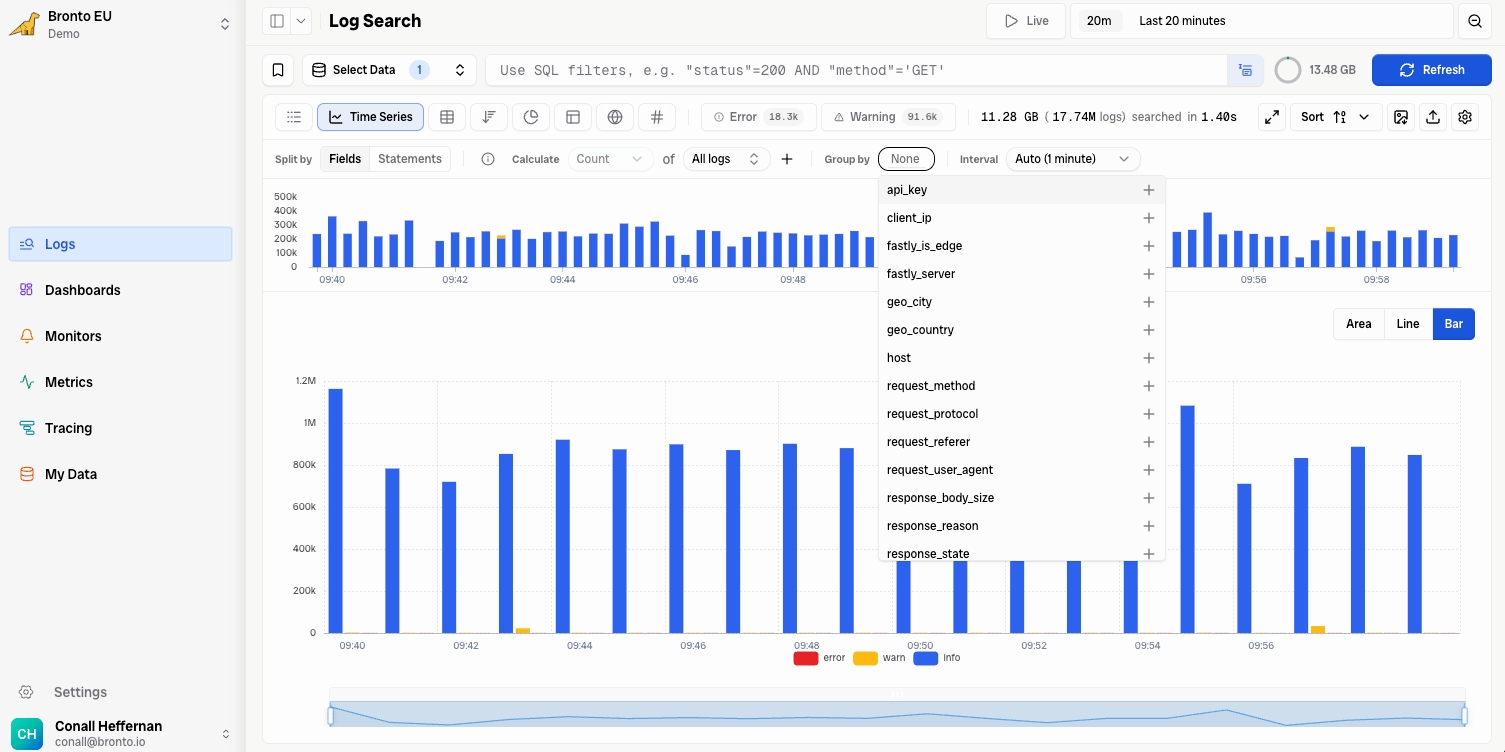
The time series views allow you to compute statistical functions over a specified time range, enabling deeper insights into your event data by visualizing trends and patterns. The following functions are supported:| Function | Description | |
|---|---|---|
| Count | The total number of events within the specified time range. | |
| Average | The average value of a specified numeric attribute in your events. | |
| Min | The minimum value of a specified numeric attribute in your events. | |
| Max | The maximum value of a specified numeric attribute in your events. | |
| Sum | The total sum of a specified numeric attribute your events. | |
| Median | The median value of a specified numeric attribute in your events. |
Automatic Parsing
Errors & Warnings
Bronto automatically detects errors and warnings in your logs enabling you to jump directly into your data for deeper analysis and faster troubleshooting. For HTTP-like logs, status codes are automatically categorized: 5xx as Error and 4xx as Warn. For application logs without a defined log level, errors are identified from stack traces, Kubernetes klog errors and Kernel Out of Memory errors.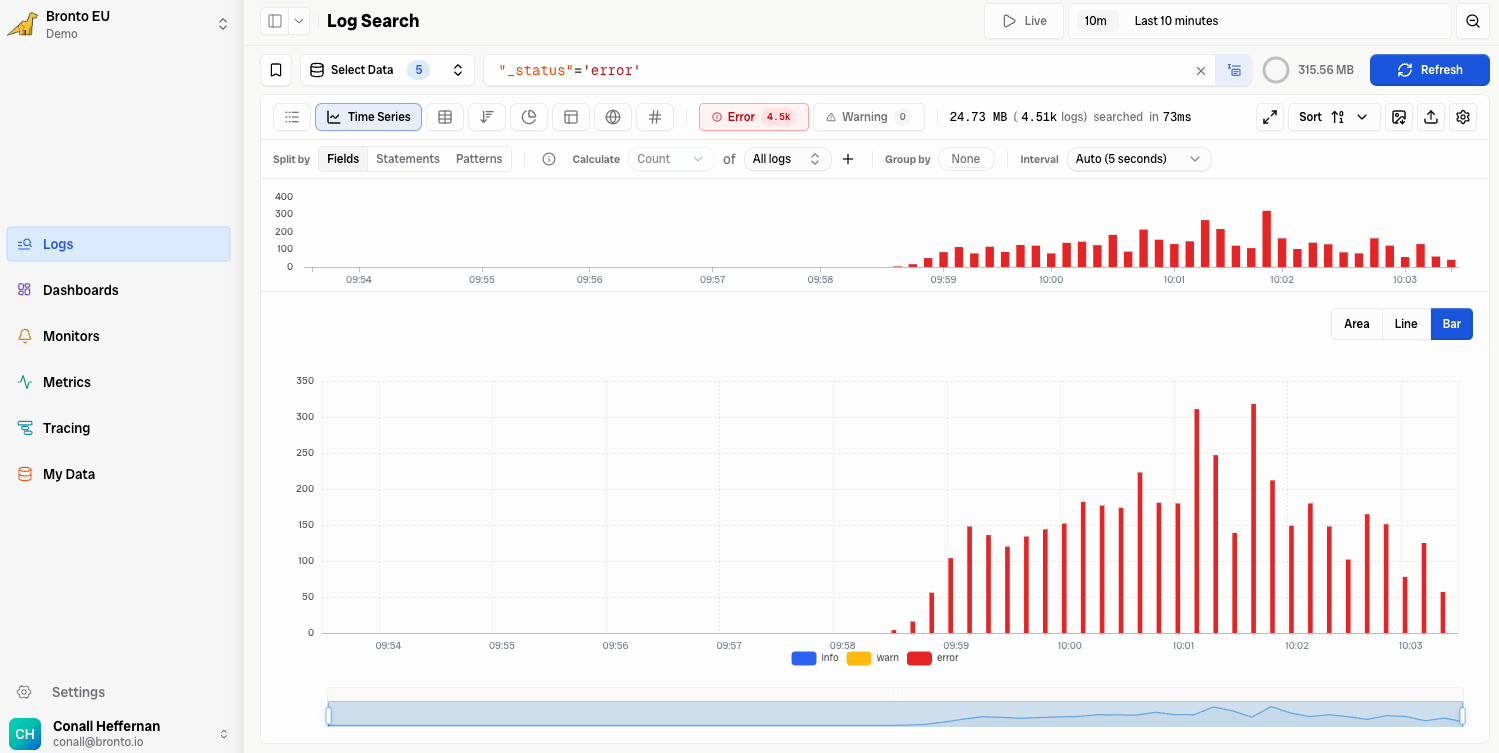
BrontoScope: AI Error Investigation
When you spot an error event in your logs, BrontoScope can investigate it for you automatically. Click any error event to open the event panel, then select Investigate with AI to generate an AI-powered investigation report with supporting evidence. For the full workflow, capabilities, and best practices, see BrontoScope.Parsing Of Attributes
Bronto automatically parses the attributes in your log data for common log formats (e.g., json, syslog, apache, java gc, etc.). For uncommon unstructured or custom log formats, Bronto will parse the attributes in your log data according to the following specification for key-value pairs: A key value pair consists of a key, followed by a separator, and then a value:- A
<delimiter>is one or more of the following characters: “,” (comma), “\t” or “\r” or “\n” or “\r\n”. - A
<key>is any sequence of: the alphanumeric characters, “_”, “.”, “$”, and “@”. Other characters are not allowed unless they are escaped using quotation marks, e.g.,"key[1]"for the attribute named key[1]. Additionally, a key must have at least one non-numeric character. - A
<separator>is the character ”=” or ”:”. It can be preceded and/or followed by a space. - A
<value>is any sequence of: the alphanumeric characters, ”-”, _”, ”.”, ”$”, and ”@”. Quotation marks can be used to escape values with special characters, e.g.,key="hello world"for the value “hello world”.
- The
timestampattribute has the value2025-07-15T14:32:18Z - The
levelattribute has the valueINFO - The
serviceattribute has the valueauth-service - The
userIdattribute has the value98675 - The
ipattribute has the value192.168.12.45 - The
actionattribute has the valuelogin
Custom Parser
If your log format needs more than Bronto’s automatic field extraction, use Custom Parser to turn unstructured events into structured, queryable data tailored to your dataset. For setup, supported formats, and implementation details, see Custom Parser.Top Key Sampling
Bronto automatically tracks the most frequently occurring keys and attributes identified during regular dataset sampling. This helps Bronto understand the most frequently occurring keys and attributes in your log data. These top keys are used to populate dropdown menus across search, dashboards, and Bronto’s monitoring features. Note: Less common keys may not appear in the top list. In such cases, users can manually type the desired key in auto-populated fields.PII Masking
You can enable PII masking in Bronto to hide any personal identifiable information that may be present in your log data. To enable PII masking you must create a custom role with theRead PII Data permission disabled, and associate the role with individual users.
Users will see ******** in place of potentially sensitive information, for example:
- Full Names
- Email addresses
- IPV4 & IPV6 addresses
- Phone numbers
Sort By Column
In the “List of Events” view, you can sort events by any column in either ascending or descending order.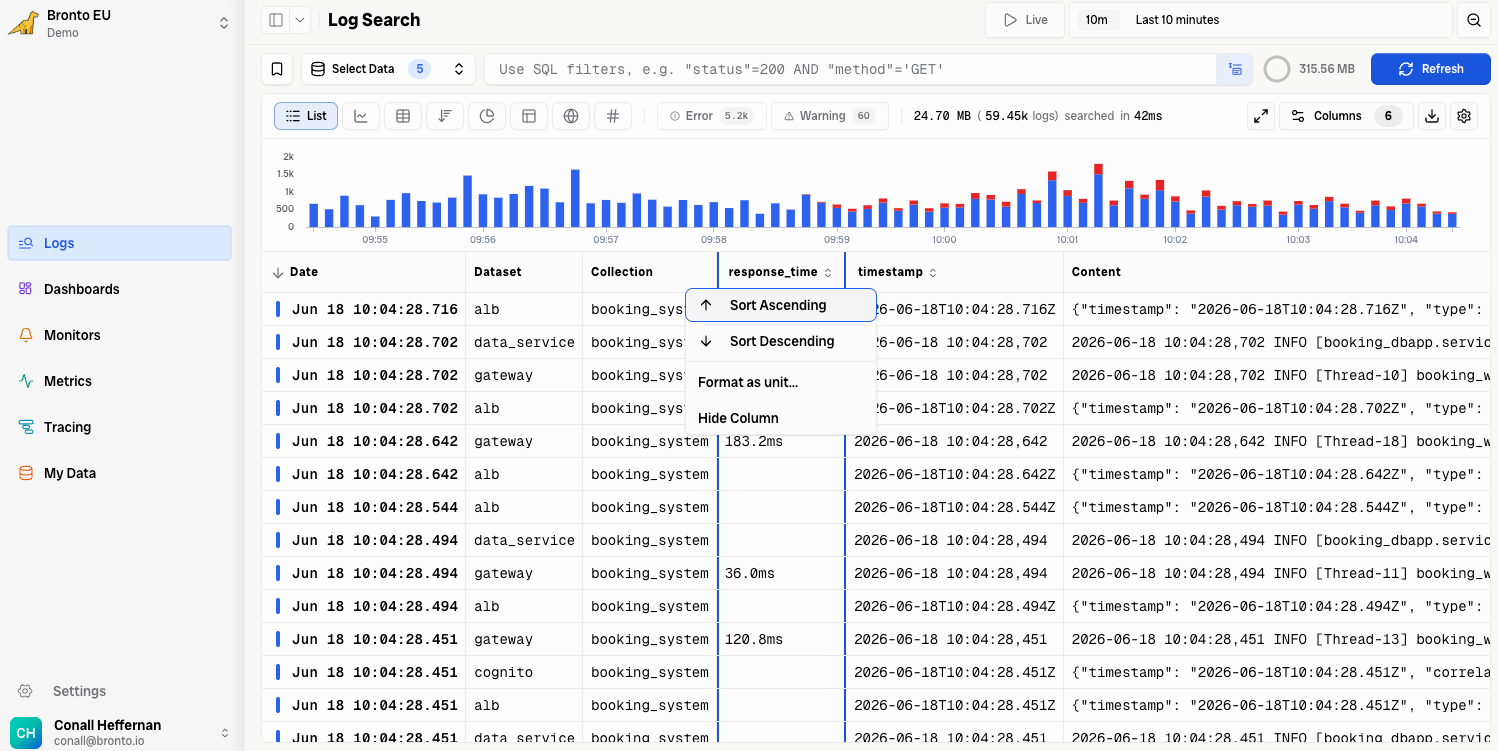
- If more than 25,000 events match your filter, only the first 25,000 matches will be included in the sort. In that case, the timeline will show a greyed-out section representing the portion of the time range that was excluded.
- To sort over a larger time range, try refining your filter to match 25,000 events or fewer.
For example, if you are interested in the slowest response times in some logs, you could filter using conditions like
duration_ms>2000orduration_ms>4000to reduce the number of matching events. - You can view up to a maximum of 1000 events from the overall sorted set of events.
Timestamps & Out-of-Order Ingestion
How Bronto Handles Timestamps
Bronto attempts to parse the timestamp directly from each log event and use it for indexing. TThe timestamp must be provided in a key called timestamp or Timestamp. Common formats such as ISO 8601 are supported. If a timestamp is absent, unrecognized, or too far in the past, Bronto falls back to the ingestion timestamp — the time the event arrived at the platform.Batching Window
Bronto accepts out-of-order events with timestamps up to 2 hours in the past. Events with timestamps older than this window may not be indexed against their original event timestamp.Default Behavior: Parallel Ingestion
By default, when multiple ingestion requests are processed in parallel, events for a dataset may arrive out of order. In this case, Bronto may reassign some timestamps during indexing to avoid adding an ingestion delay. This is acceptable for most analytical use cases — such as CDN or HTTP access logs — where aggregate patterns matter more than the precise sequence of individual events. However, in scenarios where multiple agents are batching events over longer intervals (e.g. OpenTelemetry collectors with long flush windows), this default behavior can cause spikes where many events are indexed with the same timestamp. If accurate per-event timestamps are important to you, Out-of-Order Handling can be enabled.Out-of-Order Handling
When Out-of-Order Handling is enabled, Bronto will never overwrite the timestamp parsed from a log event. Instead of reassigning timestamps, Bronto sorts events before indexing them, preserving their original order. This is particularly useful for:- Logs sent in large and sparse batches by multiple agents
- Any pipeline where there is a meaningful delay between event creation and delivery
With Out-of-Order Handling enabled, there may be a delay before events appear in search results and dashboards, as incoming data is sorted prior to indexing. For high-volume log sources receiving events in a heavily unordered fashion, Bronto may need to delay and batch the sorting process, resulting in a maximum ingestion delay of up to 5 minutes under normal circumstances.
Expected Ingestion Latency
Even under normal conditions, data travels via different components that may introduce lag. This includes:- Batching interval at source (e.g. an OTel batch processor)
- Network transit time
- Pipeline processing and parsing