Creating a Change Detection Monitor
To create a change detection monitor:- Navigate to Monitors and select + New Monitor.
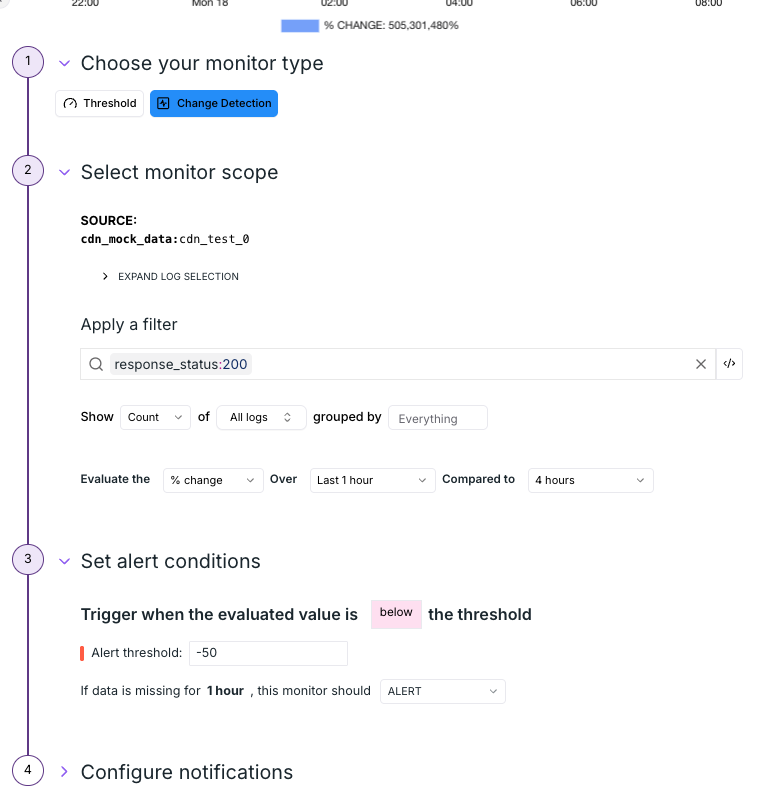
- Choose Change Detection as the monitor type.
How Change Detection Works
A change detection monitor compares two queries over time:- The monitor first runs a query for the current evaluation window (e.g. the last 15 minutes).
- It then runs the same query offset by a chosen timeframe in the past (e.g. 1 hour ago).
- The monitor computes the difference between the two query results.
- If the difference exceeds the defined threshold, an alert notification is triggered.
Change Types
When configuring your monitor, you can specify how the change is measured:- Change: The raw difference between the current and past values.
- % Change: The percentage difference relative to the past value.
Alert Conditions
In the Set Alert Conditions step, you define the threshold for triggering an alert. The following operators are supported:- Above
- Below
- Above or Equal
- Below or Equal
-50 rather than 50.
This sends an alert notification when the percentage change falls below -50%, in other words, there has been a 50% drop.
Configuration Options
When creating a change detection monitor, you’ll need to configure the following:- Source Dataset – Select the dataset(s) on which the queries will be run.
- Filters – (Optional) Narrow down results by applying filters.
- Aggregation Function – Define how data points are aggregated (e.g.
count,average,max,sum). - Change Type – Choose between Change or % Change.
- Evaluation Window – The time period over which the aggregation is calculated (N minutes, hours, days, weeks, up to maximum of 1 month).
- Timeframe Offset – How far back in time the comparison query should be run (N minutes, hours, days, weeks, up to maximum of 1 month ago).
Example Use Cases
- Detecting unusual traffic spikes compared to the same time yesterday.
- Monitoring error rates that suddenly increase compared to the previous hour.
- Tracking a drop in transaction volume relative to the past week.