
count or p95, calculated for each evaluation window. Instead of setting a fixed threshold, you choose how unusual a window must be, and Bronto works out what normal is from the series’ recent history.
Use an anomaly detection monitor when the right threshold changes over time, for example request volume that is high during business hours and low overnight, or an error count that is normal for one service and alarming for another.
Create an anomaly detection monitor
1
Navigate to Monitors and select + New Monitor.
2
Choose the data to watch. Select the dataset scope, apply an optional filter using Bronto’s search syntax, and choose the aggregation function to evaluate, such as
count, average, or p95. Optionally group the results to evaluate each group separately.3
Select Anomaly detection as the monitor type.
4
Set the conditions: the direction, how far from normal a window’s aggregate must be, the evaluation window, the baseline period, and whether to adjust for daily and weekly patterns. See Configuration options and Seasonality.
5
Choose where the monitor’s notifications will be sent.
6
Give the monitor a name and description, then save it.
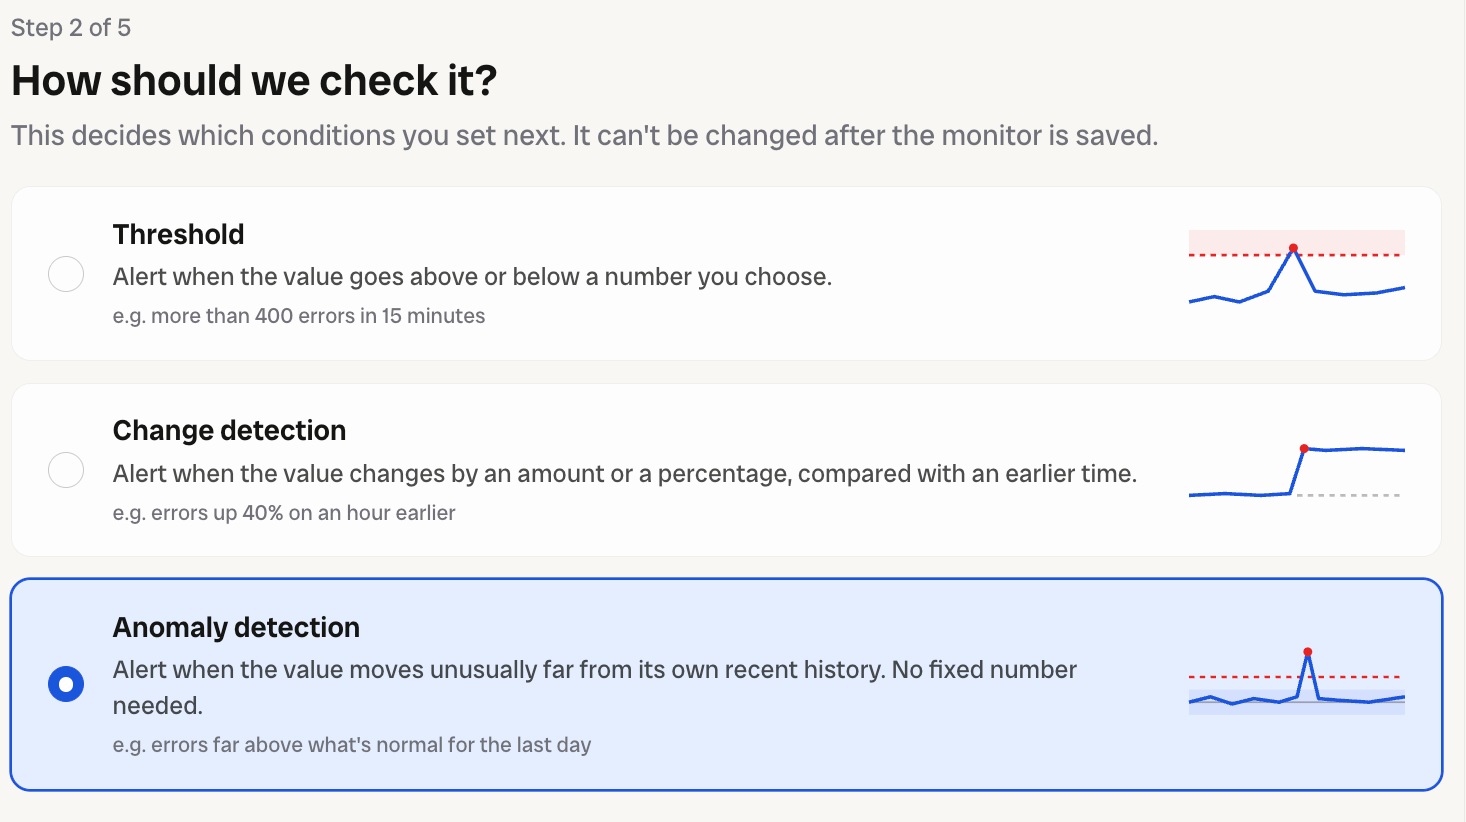
How anomaly detection works
Each time the monitor checks, it compares the latest evaluation window against a baseline built from the windows before it:- Bronto calculates the aggregate for the latest complete evaluation window.
- It takes the aggregate for every window in the baseline period and finds their median, which Bronto treats as normal.
- It measures how far the aggregates usually stray from that median, using the median absolute deviation (MAD).
- It scores the latest window by how many of those spread units it is from the median.
- If the score is beyond the alert threshold in the chosen direction, the monitor alerts.
Bronto needs at least 10 baseline windows that contain events before it can score a window. Until then, or when the baseline aggregates don’t vary at all, the window takes the monitor’s no-data status. If you set the no-data status to Alert, a sparse or newly created query can alert for this reason.
Configuration options
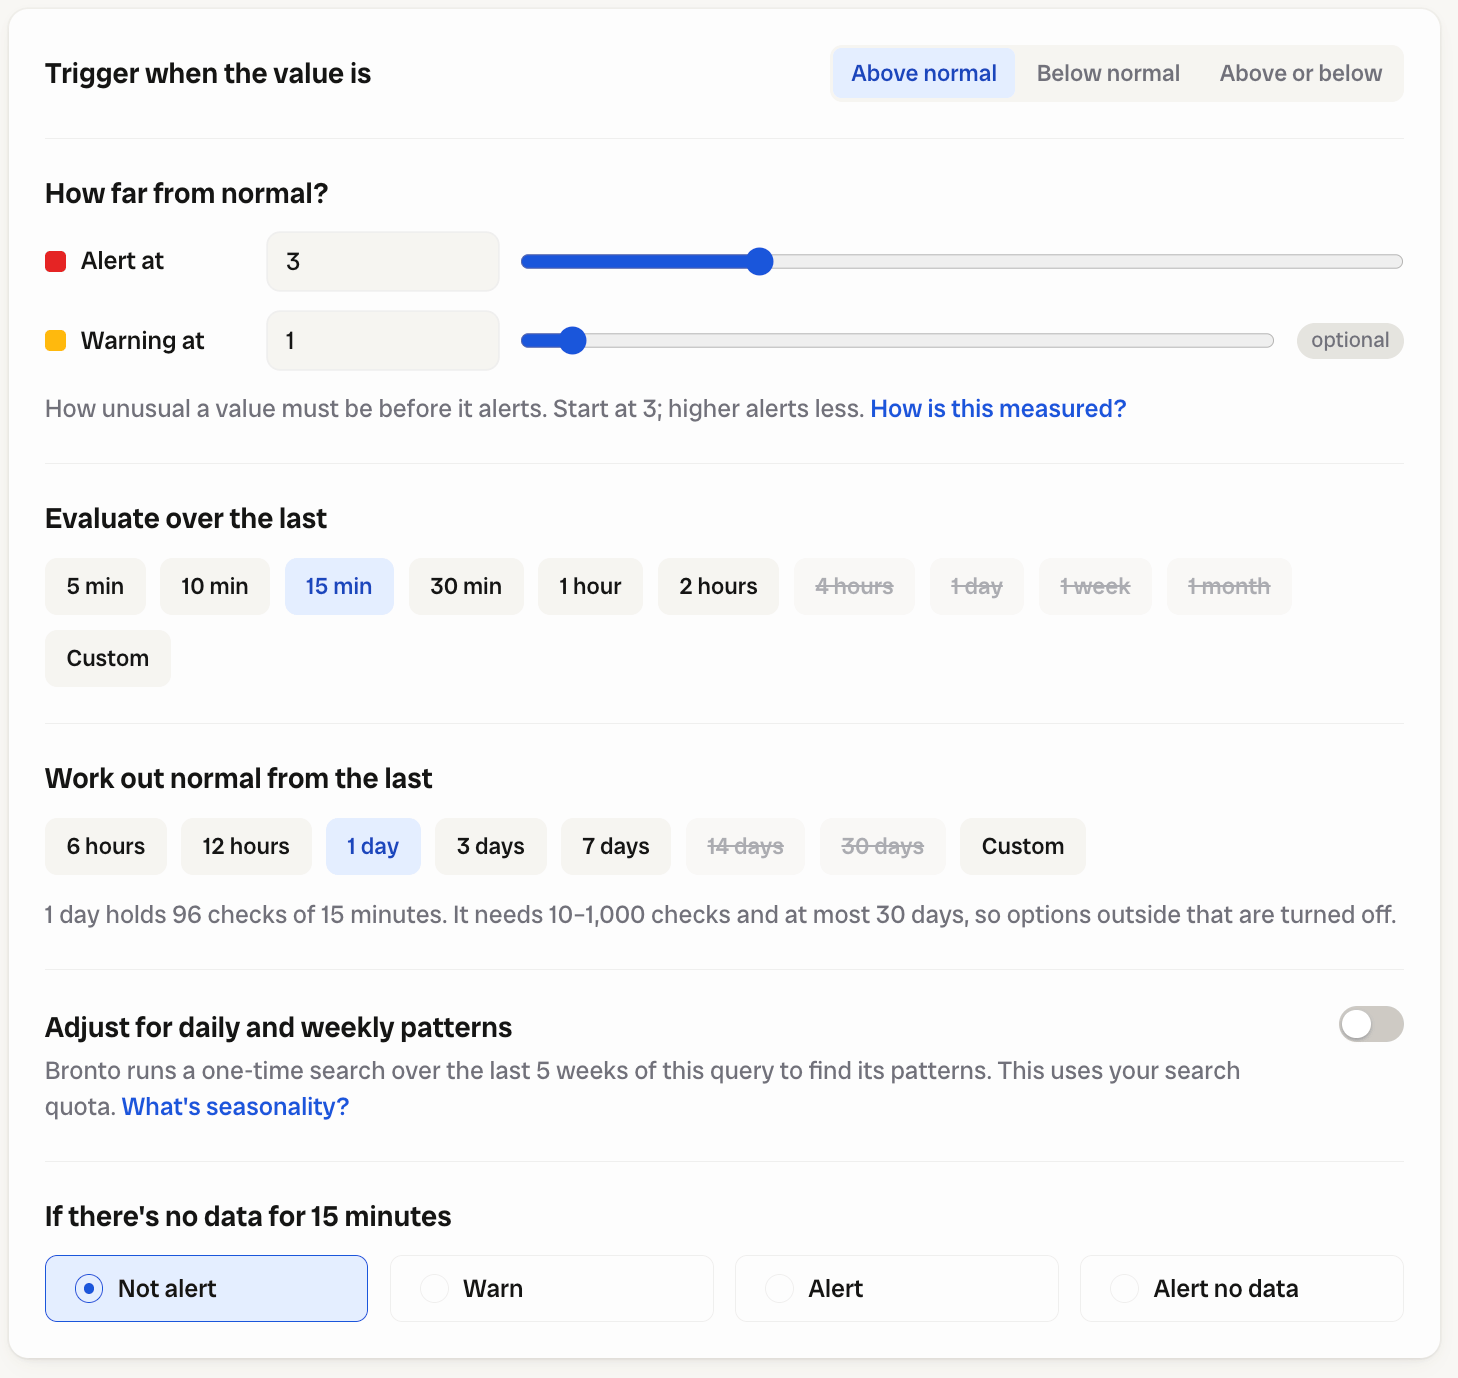
Choose a threshold
Start at3 and adjust based on how often the monitor alerts:
- 2 or lower: catches subtle changes, but alerts more often on normal variation.
- 3: a balanced starting point for most time series.
- 4 or higher: alerts only on large, obvious deviations.
Choose a baseline period
A longer baseline is steadier and less affected by a recent incident. A shorter baseline adapts faster after a lasting change, such as a new release that permanently changes traffic. The default of 1 day suits most time series.Preview the monitor
While you set the conditions, the Preview chart shows how the monitor would have behaved over a past range, so you can tune it before saving. Choose the range, up to 14 days, from the date picker above the chart. The chart shows:- The time series: the aggregate for each evaluation window.
- Typical range: the shaded band where the series is normal, with the baseline median as a line through it.
- Alert threshold: the dashed line the series must cross to alert.
- A marker on every window that would have alerted, and a count of the checks that would alert.
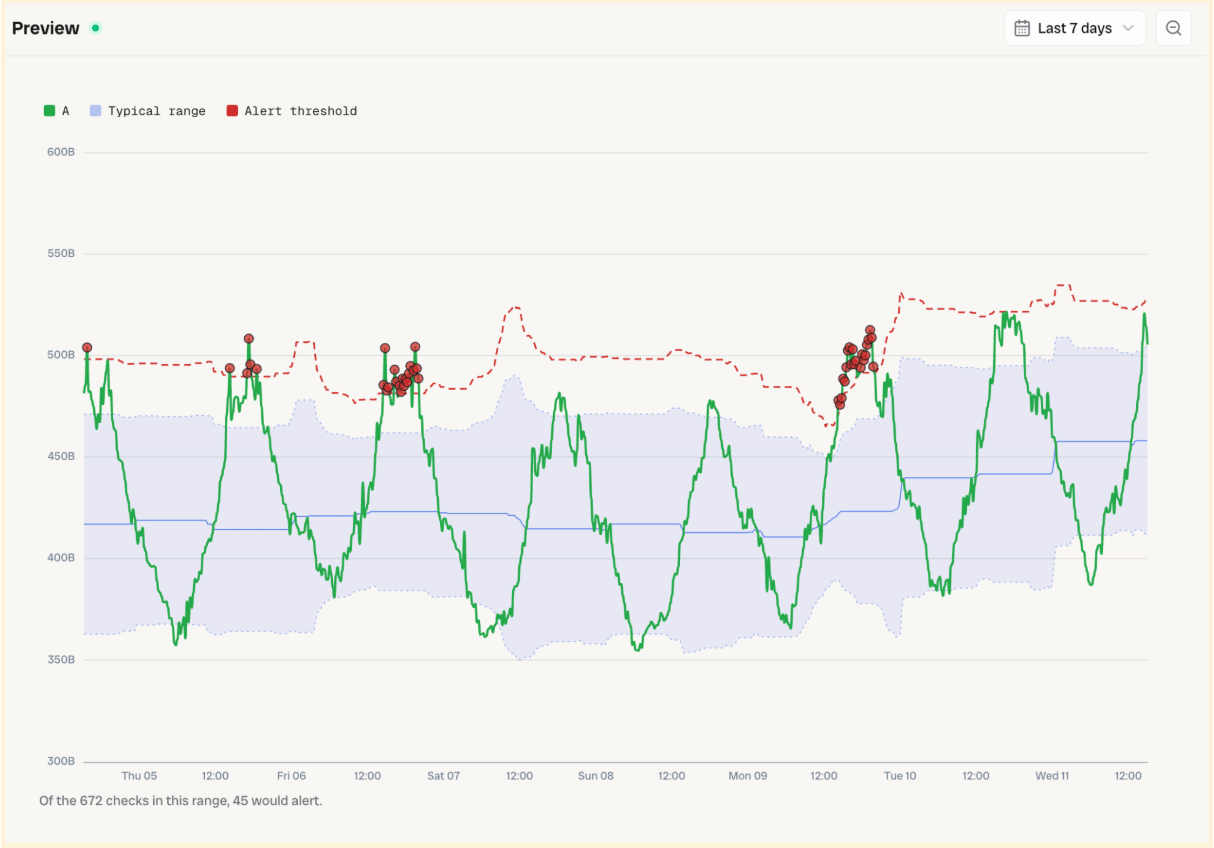
Without seasonality: the typical range stays flat, so ordinary daily peaks alert
Seasonality
Many time series follow a regular cycle. Checkout errors might climb every lunchtime, or logins might dip every Sunday. Without seasonality, Bronto compares every window’s aggregate to one overall normal, so a busy Monday morning can look unusual. With Adjust for daily and weekly patterns turned on, Bronto compares each window’s aggregate to what is normal for that time of day and day of the week. When you turn seasonality on, Bronto runs a one-time search over the last 5 weeks of the query to learn its daily and weekly pattern. This search uses your search quota and can take a few minutes. The preview chart shows its progress:
Until a pattern is available, the monitor evaluates without seasonal adjustment rather than waiting. When the query is grouped, Bronto learns a separate pattern for each group.
When a pattern is found, the typical range on the preview follows it, and Bronto shows how many checks would alert With seasonality and Without seasonality, so you can see what the adjustment changes before saving.
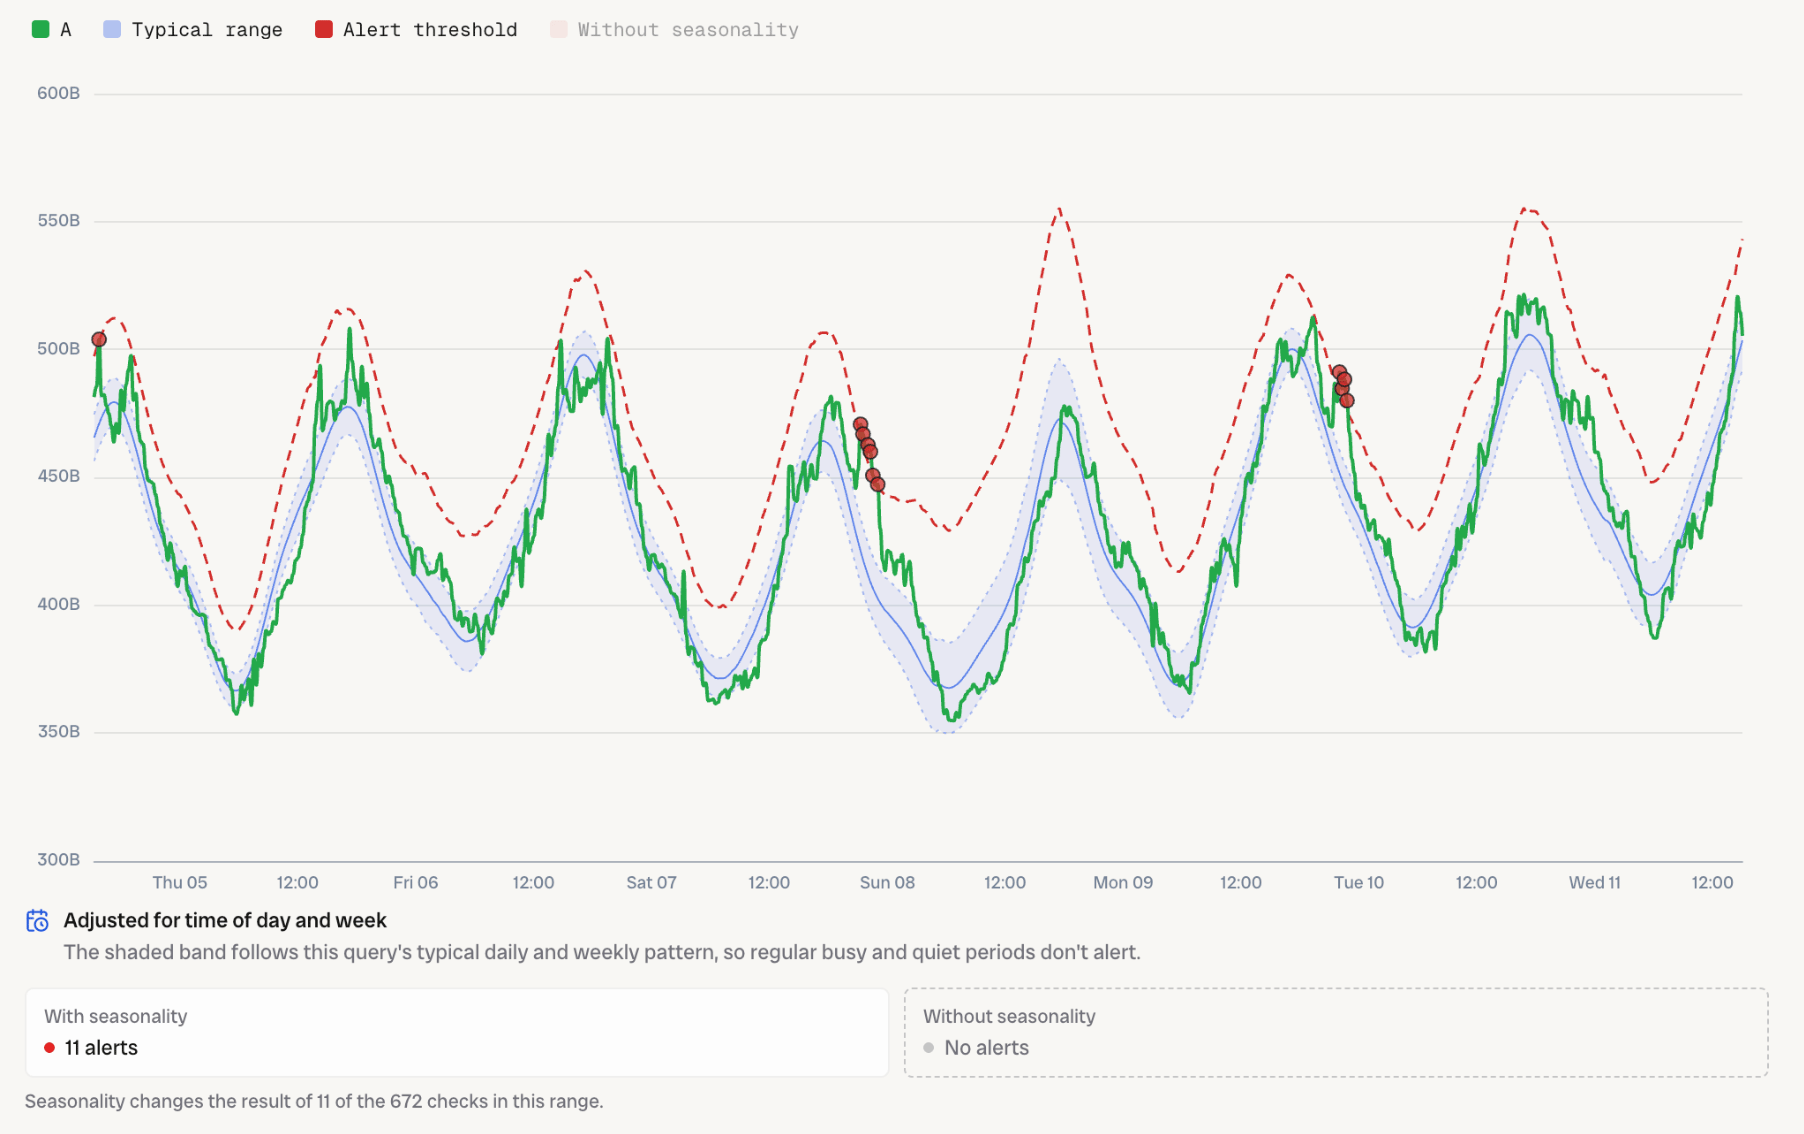
With seasonality: the typical range follows the daily cycle, so only unusual windows for that time of day alert
A query needs at least 5 weeks of history for seasonality to apply. For a new dataset or a recently changed filter, leave seasonality off until enough history exists.
Groups
When the query is grouped, Bronto detects anomalies separately for each group, so one service’s normal volume doesn’t hide another service’s anomaly. The monitor evaluates up to 1,000 groups, and the preview chart shows the 10 busiest of them. See Grouped monitors for the limits that apply to every monitor type. For grouped monitors, you can also choose:- Notify for every group that changes status, or Notify only when the overall status changes. The overall status changes when the first group alerts and when the last group recovers. If more than 100 groups change status at the same time, Bronto sends a single combined notification either way.
- Stop tracking a group after no data for a period of up to 7 days. The default is 1 hour.
Notifications
Notifications are configured in the same way as for other monitors. See Configure notifications. To have Bronto investigate automatically when the monitor fires, enable AI Investigation Reports. Anomaly notifications describe the deviation, for example: The query ‘checkout errors’ is more than 3 scaled MADs above its trailing 24 hours baseline. Webhook payloads for anomaly detection monitors include these additional variables:
See Sample Payload Schema for the variables shared by all monitors.
View anomalies
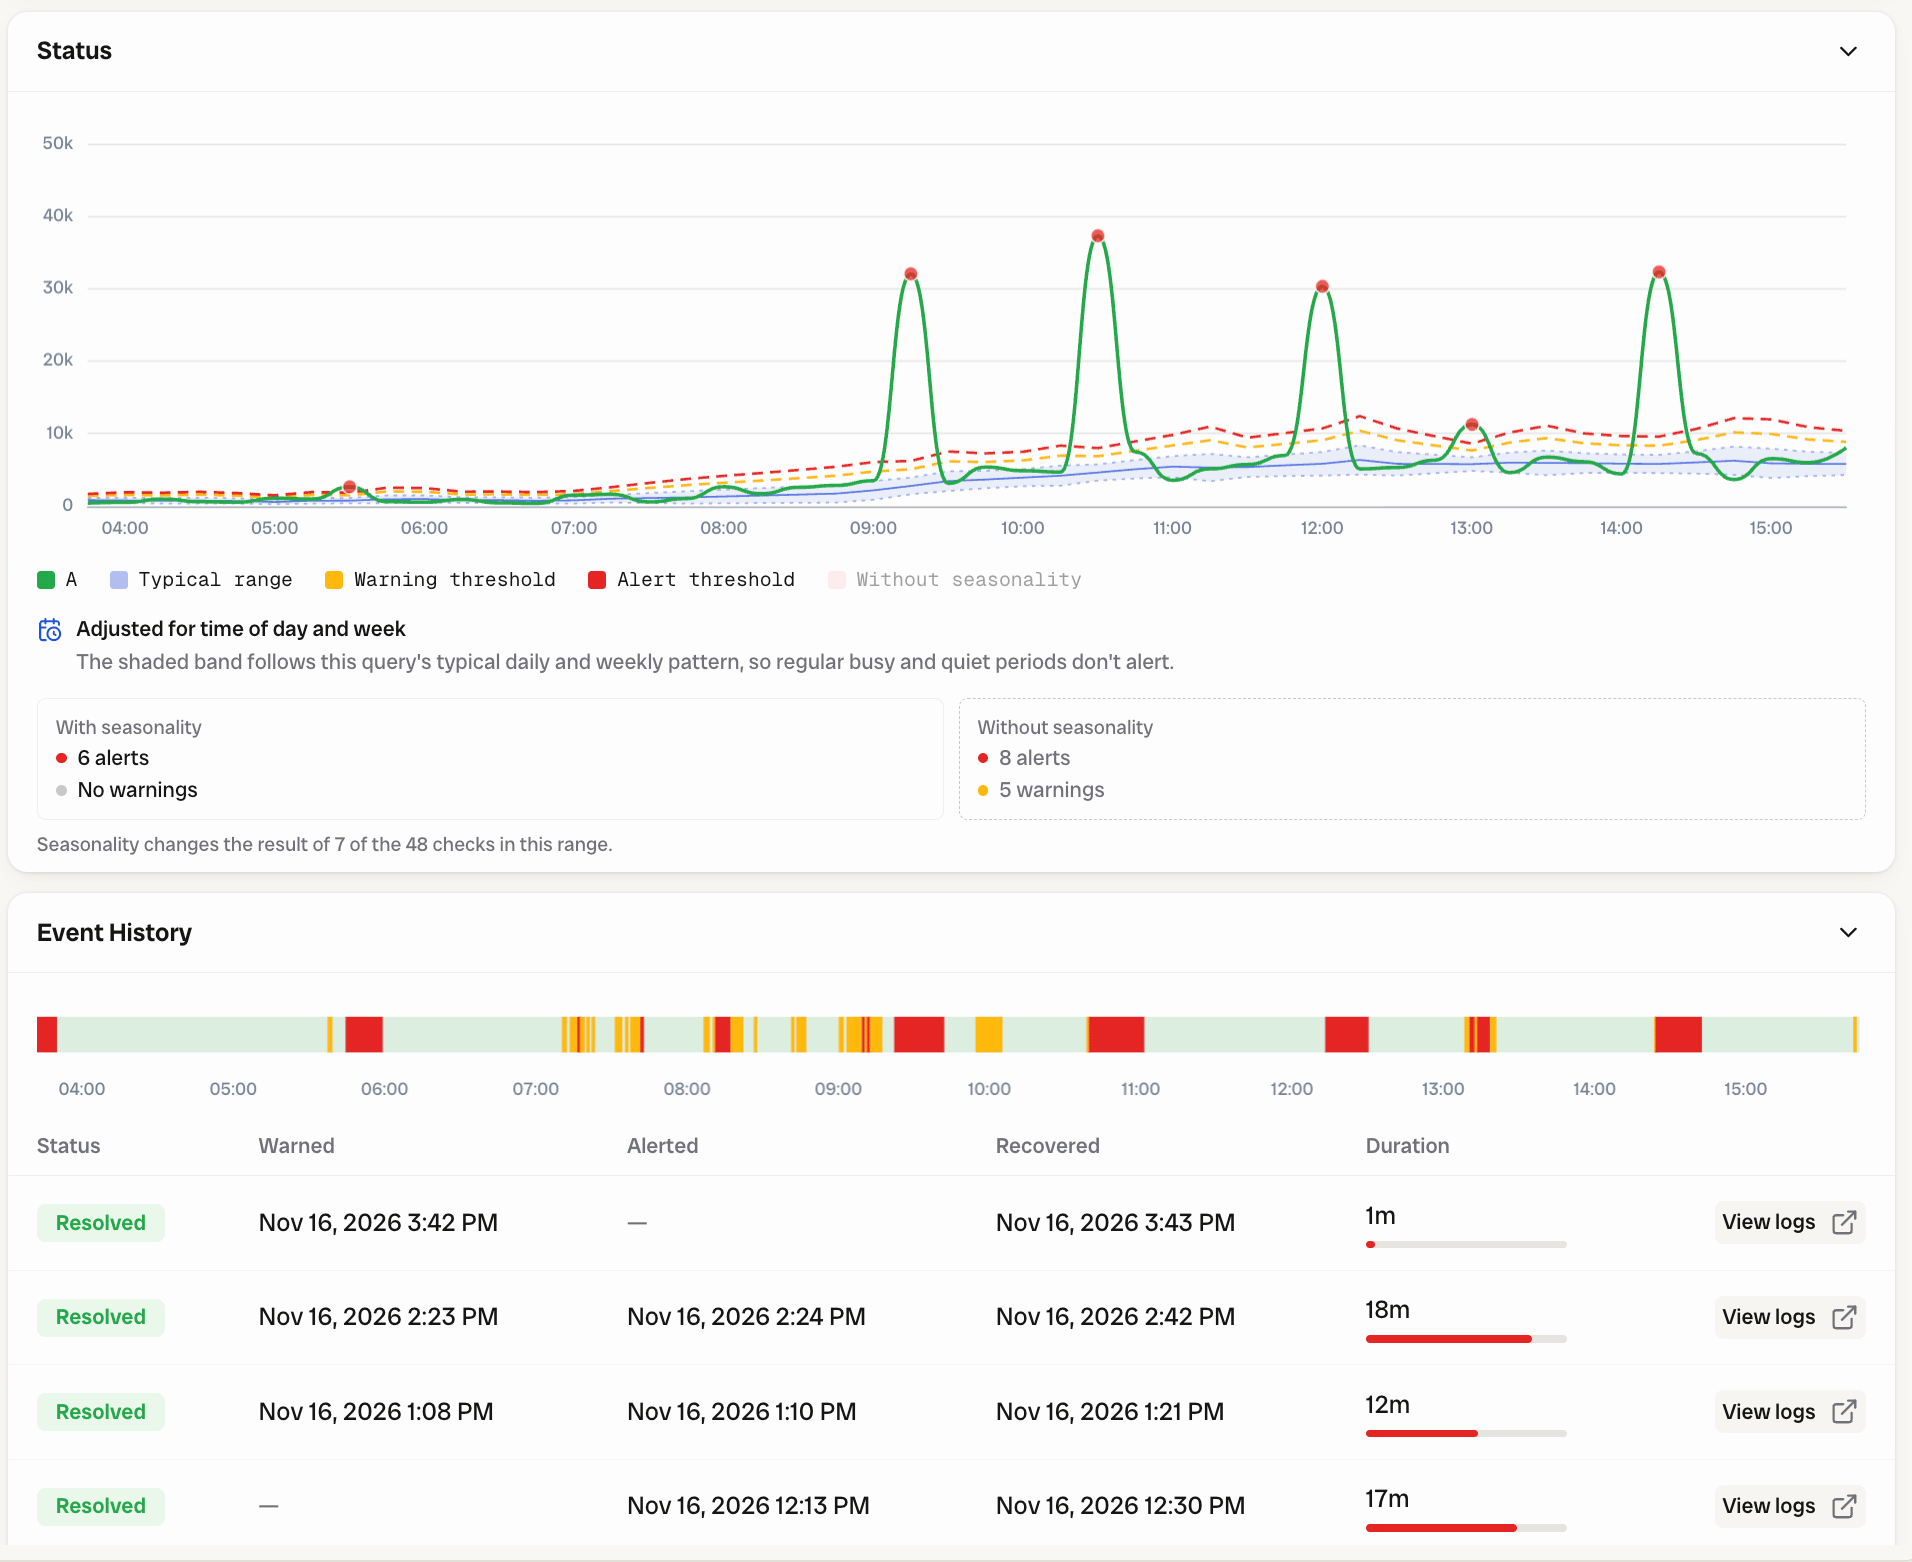
Select a monitor from the list to see its details and history. The monitor information shows the baseline period, the baseline algorithm, and whether seasonality is Adjusted or Off.- Status charts the time series against the typical range and the warning and alert thresholds, with a marker on each window that alerted. For a seasonally adjusted monitor, it also compares the alerts and warnings With seasonality and Without seasonality.
- Event History shows a timeline of OK, warning, and alert periods, and a table of each event with when it warned, alerted, and recovered, and how long it lasted. Select View logs to open the matching logs in search.
Manage with the API and Terraform
Anomaly detection monitors can be created through the Bronto API and the Terraform provider, and exported to HCL like other monitors. They use these fields:In the API and Terraform,
window is the evaluation window shown in the UI as Evaluate over the last, and evaluation_window is the baseline period shown as Work out normal from the last.Choose a monitor type
Example use cases
- Detecting a drop in checkout events outside the usual weekday and weekend pattern.
- Alerting on unusual error volume for any one service, without a separate threshold per service.
- Catching latency regressions on endpoints whose normal latency varies through the day.
- Spotting unexpected overnight traffic that a fixed daytime threshold would miss.