

docker build and docker buildx — is already instrumented with OpenTelemetry. It records a trace for every build with one span per Dockerfile step, and exports straight to Bronto over OTLP/HTTP, so no Collector is involved. To collect runtime logs from your running containers instead, see Docker.
Prerequisites
- A Bronto account and API key (how to create one)
- Docker Engine with Buildx (verified with Docker 29.6, Buildx v0.35, BuildKit v0.31)
- A builder on the
docker-containerdriver — the defaultdockerdriver runs BuildKit inside the Docker daemon, where these variables cannot be set
See the trace locally
BuildKit keeps a record of recent builds, so you can view a trace before configuring anything:Configure the builder
<REGION> to eu or us. service.name identifies the builder in Explore Traces; it does not select or create a dataset. From here, every docker buildx build sends its trace to Bronto.
Use docker buildx build rather than docker build. On Docker Desktop, docker build runs on the built-in docker driver regardless of the builder selected with --use, so it will not be instrumented.
Export OTEL_SERVICE_NAME in your shell as well as on the builder. A build emits spans from two processes: BuildKit emits the steps, and the buildx CLI emits the root build span. Without the shell export the CLI reports service.name=buildx, so the root span has a different service identity from its own steps.
What you will see in Bronto
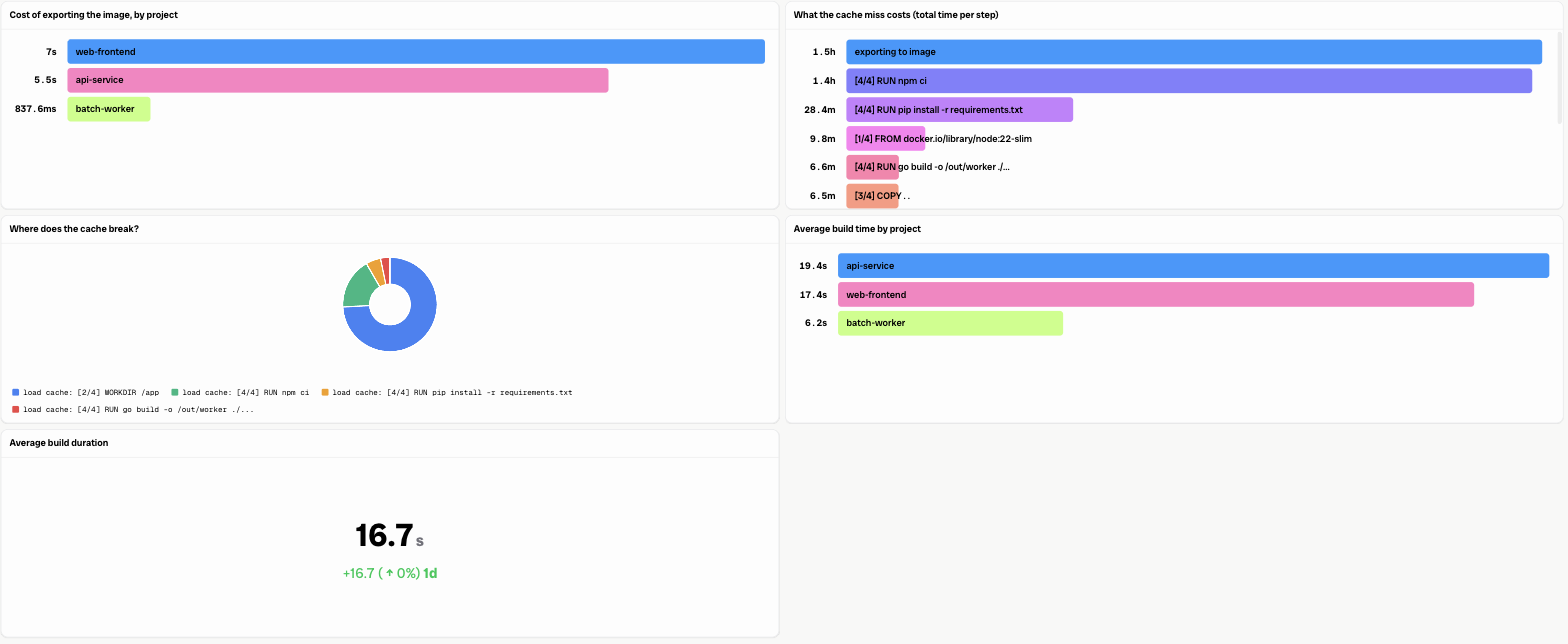
Open Tracing and filter by your service name — build traces appear under Tracing, not log search. Span names are the Dockerfile steps verbatim, such as[4/4] RUN npm ci and exporting to image. A step that ran appears under its own name; a step served from cache appears as load cache: <step>, emitted for the deepest still-valid step, so it identifies exactly where the cache broke.
Grouping spans by name and summing $span.duration_nano shows where build time actually goes, and counting load cache: spans shows which step invalidates most often.
Troubleshooting
- No traces? Use
OTEL_EXPORTER_OTLP_TRACES_ENDPOINTwith the full/v1/tracespath. The baseOTEL_EXPORTER_OTLP_ENDPOINTvariable appends/v1/{signal}, producing/v1/traces/v1/traces, and the export then fails silently. Also confirmOTEL_EXPORTER_OTLP_HEADERSis set on the builder. - Trace has no root span?
OTEL_SERVICE_NAMEis not exported in the shell running the build. - Slow first build? A new
docker-containerbuilder starts with an empty cache. - In CI, docker/setup-buildx-action sets its own
OTEL_*variables, which can conflict with these.
For assistance or questions, contact support@bronto.io.