

gen_ai.* attributes, with no Bronto-specific SDK.
Spans come from two independent sources. You can use either one or both:
With both, the SDK propagates the W3C
traceparent header and the API spans nest under your application’s spans, so one user request becomes one trace in Bronto, from your own code down to each model call and tool use.
OpenTelemetry export on the Claude Platform is in beta. Span names, attributes, and SDK options can change between releases. This page was verified on October 15, 2026 with the Python SDK
anthropic==1.14.0 and opentelemetry-sdk==1.45.1. Pin your SDK version, and inspect a real trace before building version-sensitive dashboards.Prerequisites
- A Bronto API key with the Ingestion role. See API Keys.
- Your Bronto region:
euorus. - For API tracing: the admin role in your Claude Console organization.
- For SDK tracing: a Claude SDK version with OpenTelemetry support (Python, TypeScript, Go, Java, C#, PHP, or Ruby). The examples below use Python 3.10 or later.
Send API traces from the Claude Console
A destination tells the Claude API where to push spans. The API sends OTLP/HTTP protobuf over HTTPS, which Bronto’s ingestion endpoint accepts directly, so you don’t need a Collector.- In the Claude Console, open Settings → OpenTelemetry (direct link) and click Add destination.
-
Fill in the form:
The whole setup in 36 seconds, from the Console dashboard to the saved destination
-
Click Add destination. To send a test span, open the destination’s More actions menu and click Test. An
anthropic.testspan is delivered to Bronto. -
Send a request from a covered workspace, for example from the Console playground or with
curl. Within about a minute, the destination’s Delivery column changes from No data to Healthy.
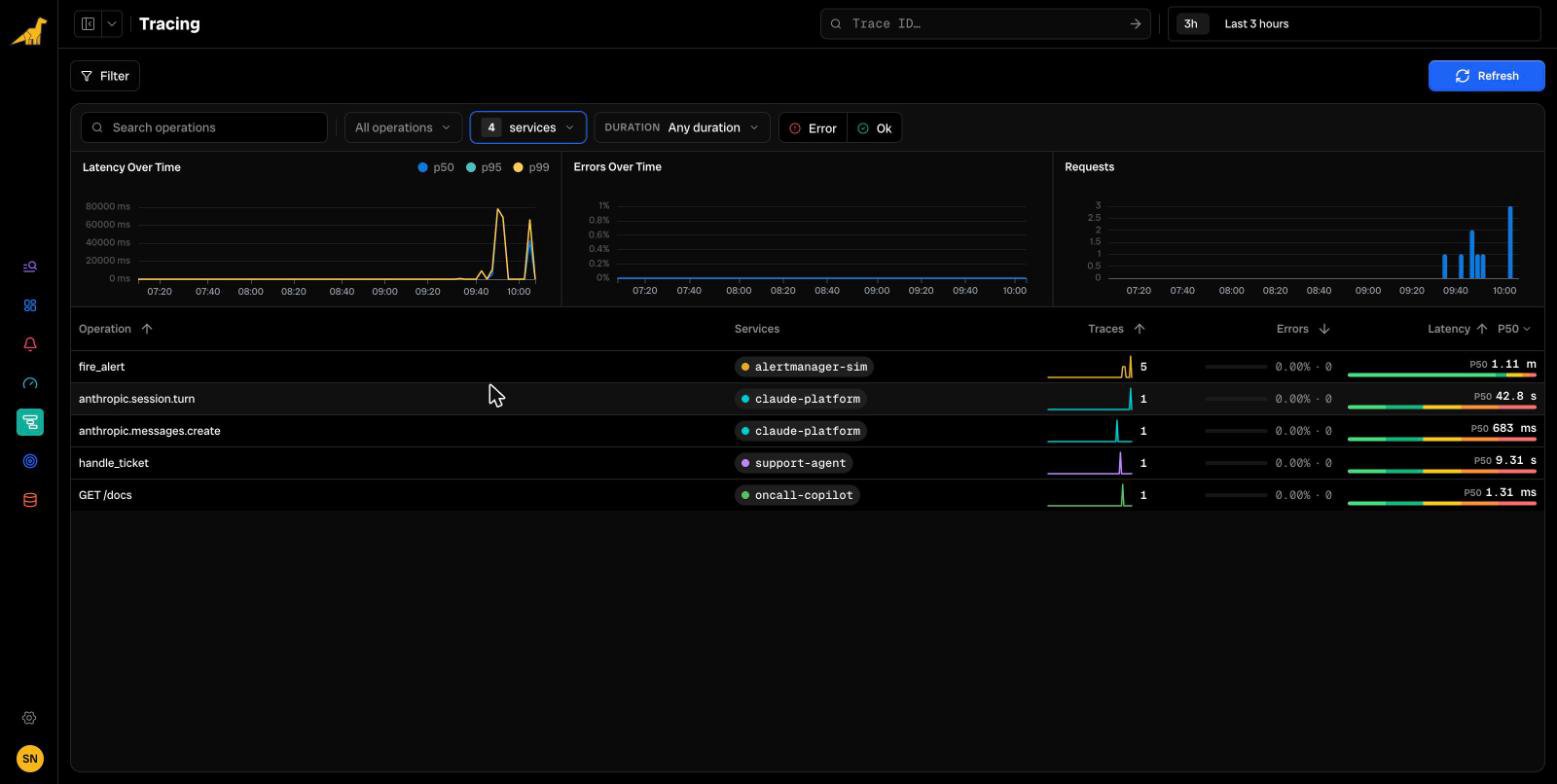
service.name = claude-platform. In Explore Traces, filter on that service to find them. The operation table lists the root span of each trace, so with SDK tracing enabled you’ll find most Claude traces under your own service’s operations rather than under claude-platform.
Add the destination with the Admin API
To automate the setup, create the destination with an Admin API key (sk-ant-admin…). A regular API key returns 401.
content_mode to content for full prompts and responses.
Send SDK traces from your application
The Claude SDK emits its spans through whichever OpenTelemetry tracer provider your application registers. Point that provider’s OTLP exporter at Bronto and the SDK calls themselves stay unchanged.app.py
ANTHROPIC_OPEN_TELEMETRY_TRACES_CONTENT_MODE=content, or pass open_telemetry={"traces": {"content_mode": "content"}} to the client.
For TypeScript, Go, Java, C#, PHP, and Ruby, register a tracer provider with an OTLP/HTTP exporter in the same way. The per-language setup is in Use OpenTelemetry with the Claude SDK and Bronto’s OpenTelemetry language guides.
What you’ll see in Bronto
One trace from your code to the model
With both sources enabled, the example above produces this trace. Spans from your app use yourservice.name; spans from the Claude API use claude-platform.
alertmanager-sim) calls a FastAPI service (oncall-copilot), which runs the Claude tool runner, then hands the incident to a Managed Agents session. The trace has 59 spans across three services.
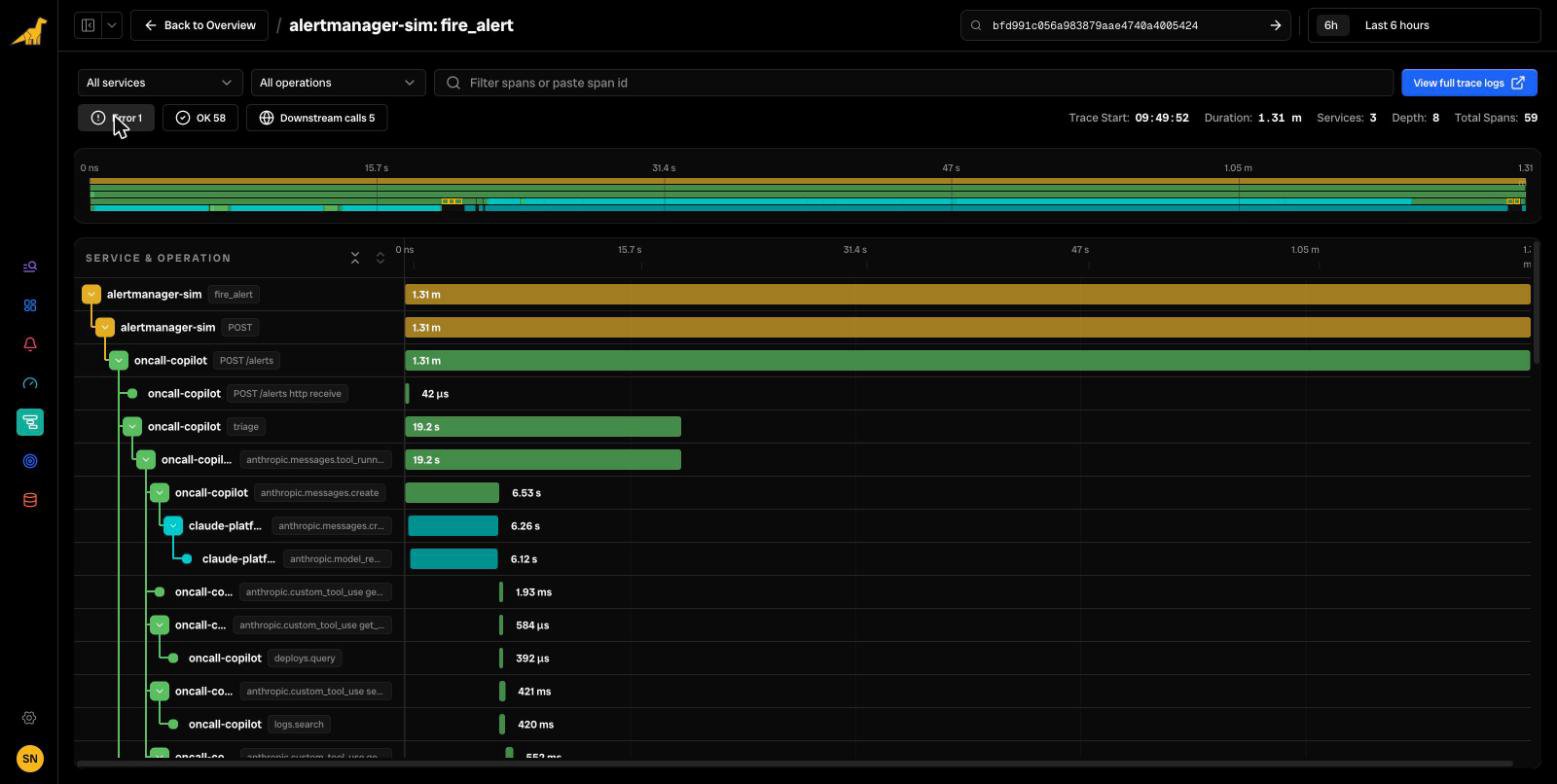
anthropic.tool_use <name> span for each use between the anthropic.model_request spans, with the arguments, the result, and an ERROR status when the tool fails.
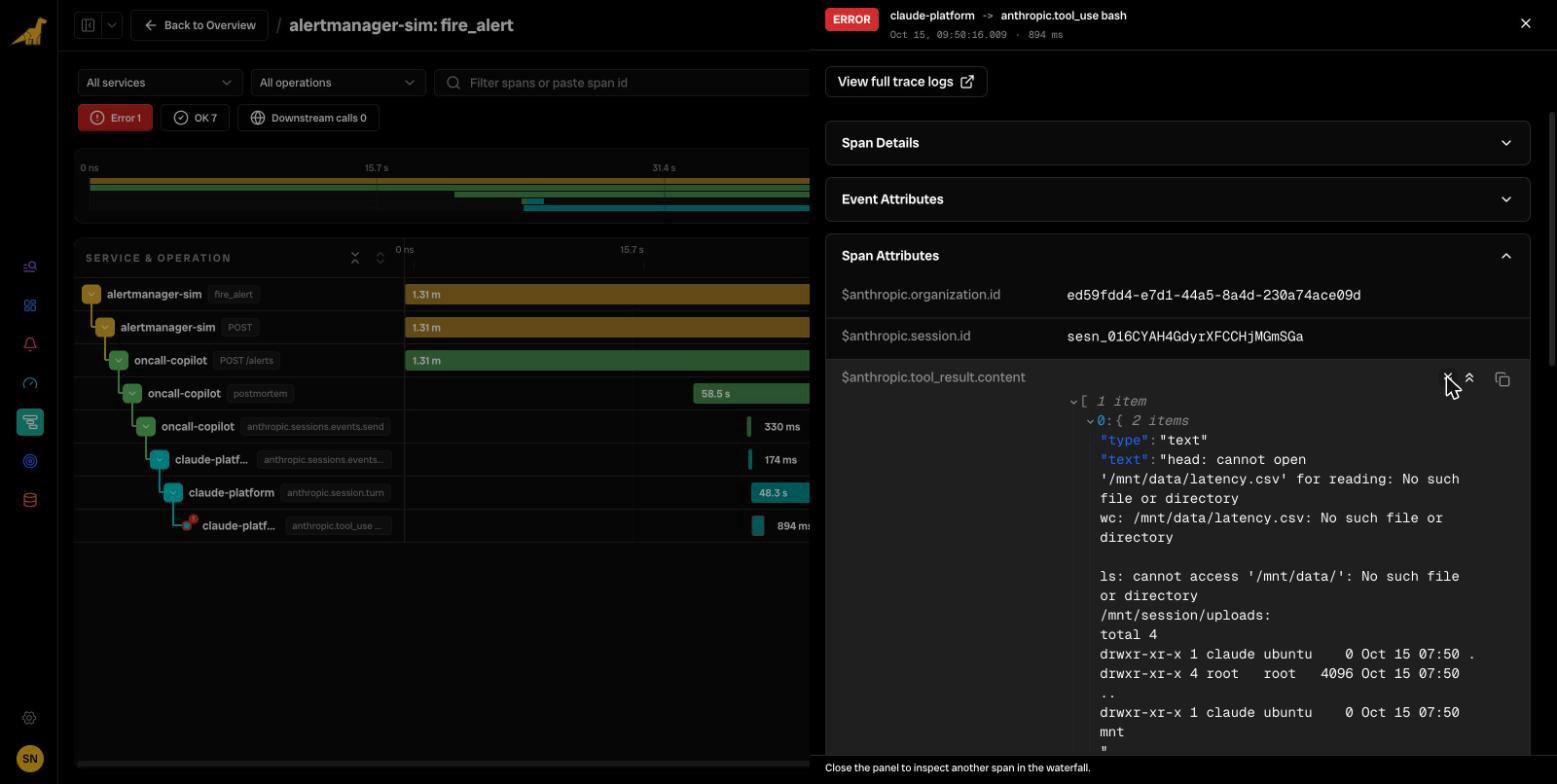
A Managed Agents session adds anthropic.session.turn spans under the anthropic.sessions.events.send request that started each turn, with the model requests and the sandbox’s tool uses (for example anthropic.tool_use bash) beneath them. A turn can also start a trace of its own: in our tests, one turn arrived as a root span with no parent. To see a whole session, filter on $anthropic.session.id rather than following a single trace.
With API tracing only, each request is its own trace rooted at the SERVER span. With SDK tracing only, you get the CLIENT and tool spans without the model-run and server-tool detail.
Span attributes
The attributes worth knowing:
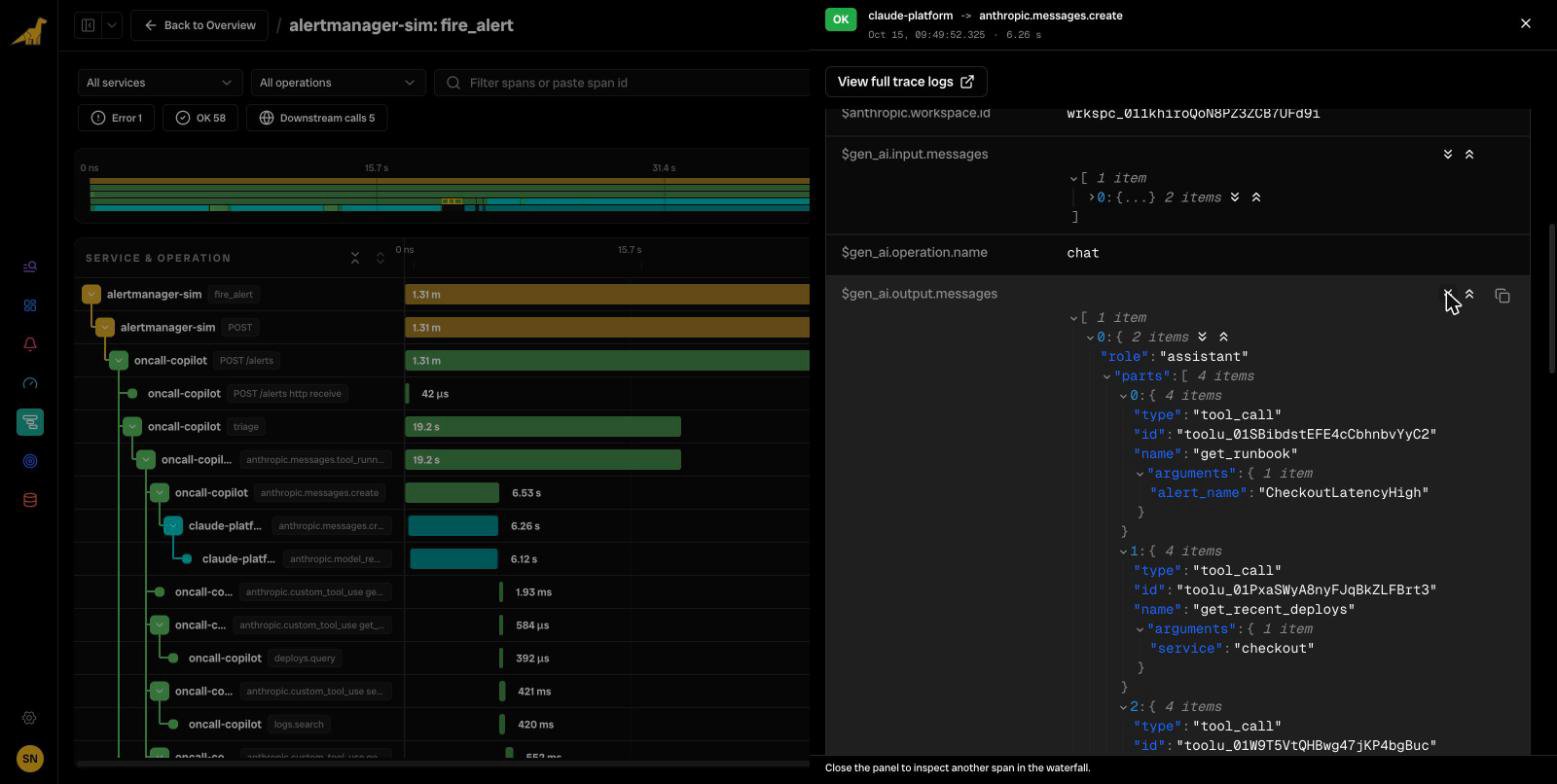
Select a span in the trace view to see its attributes. With Full content,
gen_ai.output.messages shows exactly what the model returned. Here the model asked for four tool calls in parallel:
Search and aggregate
Bronto indexes span attributes with a$ prefix, so you can filter on them as field predicates. For example, all model runs on a given model:
bash command against a file path that didn’t exist. The agent recovered, and its output looked fine, but the span keeps the command and its error output:
$gen_ai.usage.input_tokens and $gen_ai.usage.output_tokens over anthropic.model_request spans, grouped by $gen_ai.request.model or $anthropic.workspace.id, gives per-model or per-workspace consumption.
Prompts and responses
Each destination and each SDK client has a content mode:- Metadata only (default): identifiers, timing, status, token counts, model names, and the names and descriptions of your agents and tools.
- Full content: also the system prompt (
gen_ai.system_instructions), the messages sent (gen_ai.input.messages), the response (gen_ai.output.messages), and tool arguments and results. Content follows the GenAI “parts” format, for example[{"role":"user","parts":[{"type":"text","content":"…"}]}]. Each span holds up to 0.75 MB of content by default. Longer content is shortened and the span getsanthropic.content.truncated = true.
Full content sends prompts and responses to Bronto, where they’re stored under your Bronto retention and access controls. Exercise caution when capturing prompts and responses: depending on your application, they may contain sensitive data. Organizations with a HIPAA, FERPA, or K-12 data-handling restriction with Anthropic export metadata only, whatever the destination’s content mode.
Troubleshooting
References
- On-call Copilot lab: a runnable example app that produces the traces on this page
- LLM Observability
- Send Traces to Bronto
- Explore Traces
- OpenTelemetry for the Claude API
- Use OpenTelemetry with the Claude API (destinations)
- Use OpenTelemetry with the Claude SDK
- OpenTelemetry span reference
- OpenTelemetry GenAI semantic conventions
For assistance or questions, contact support@bronto.io.