> ## Documentation Index
> Fetch the complete documentation index at: https://docs.bronto.io/llms.txt
> Use this file to discover all available pages before exploring further.
# AWS Kinesis Firehose for CloudWatch Metrics
> Send Amazon CloudWatch metrics to Bronto through CloudWatch Metric Streams and an Amazon Data Firehose HTTP destination.
## Overview
[CloudWatch Metric Streams](https://docs.aws.amazon.com/AmazonCloudWatch/latest/monitoring/CloudWatch-Metric-Streams.html) can continuously export AWS service metrics to Amazon Data Firehose. Configure the metric stream to use the OpenTelemetry 1.0 output format, then configure Firehose to deliver those metrics to Bronto's dedicated AWS metrics endpoint.
This integration requires no Lambda function. Firehose handles batching, compression, and retries for delivery to Bronto.
Metrics ingestion is in public beta. Bronto supports sums, gauges, summaries, and explicit histograms. Exponential histograms are not supported, and the Metric Explorer does not currently provide a Rate function.
## Prerequisites
Before you begin, you need:
* a Bronto API key with the ingestion role
* your Bronto region: `eu` or `us`
* permission to create or configure Firehose delivery streams, CloudWatch Metric Streams, and their IAM service roles
See [API Keys](/Account-Management/API-Keys) for how to generate a key.
## Step 1 — Create a Firehose delivery stream
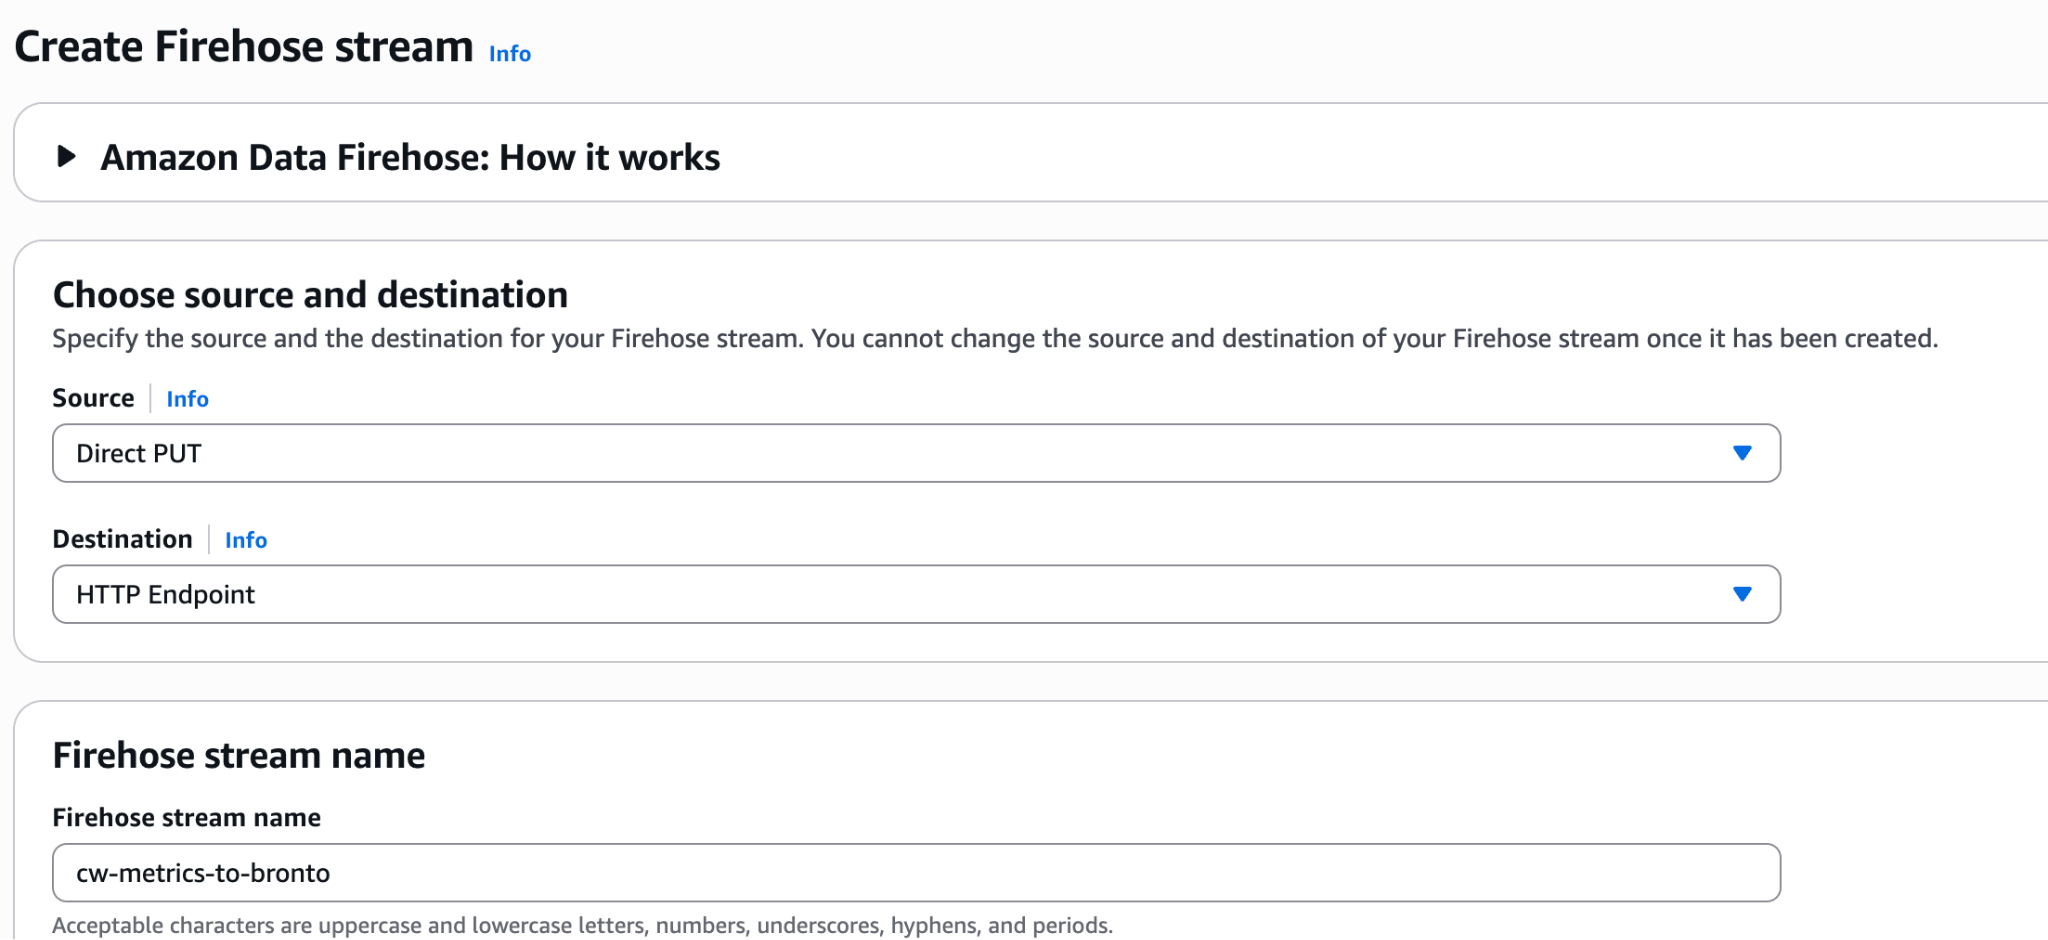
In the AWS Console, go to **Amazon Data Firehose → Create Firehose stream** and configure:
| Setting | Value |
| -------------------- | ---------------------- |
| Source | **Direct PUT** |
| Destination | **HTTP Endpoint** |
| Firehose stream name | Any valid, unique name |
`cw-metrics-to-bronto` is a suggested name only. You can use a different name that follows your organization's naming conventions.
 ## Step 2 — Configure the Bronto HTTP endpoint
Configure the HTTP endpoint destination:
| Setting | Value |
| ----------------- | -------------------------------------------------- |
| HTTP endpoint URL | `https://ingestion..bronto.io/aws/metrics` |
| Access key | A Bronto API key with the ingestion role |
| Content encoding | **GZIP** |
Replace `` with `eu` or `us`. For example, use `https://ingestion.eu.bronto.io/aws/metrics` for the EU environment or `https://ingestion.us.bronto.io/aws/metrics` for the US environment. Do not use the direct OTLP `/v1/metrics` endpoint for this Firehose workflow.
Optionally, add `x-bronto-tags` in the destination's **Parameters** section to attach comma-separated tags to the ingested metrics, for example `environment=staging,region=eu-west-1`.
Let Firehose create a service role, or select an existing role with the permissions required to deliver to the HTTP endpoint. See AWS's [HTTP endpoint destination settings](https://docs.aws.amazon.com/firehose/latest/dev/create-destination.html) for further reading.
## Step 3 — Create a CloudWatch metric stream
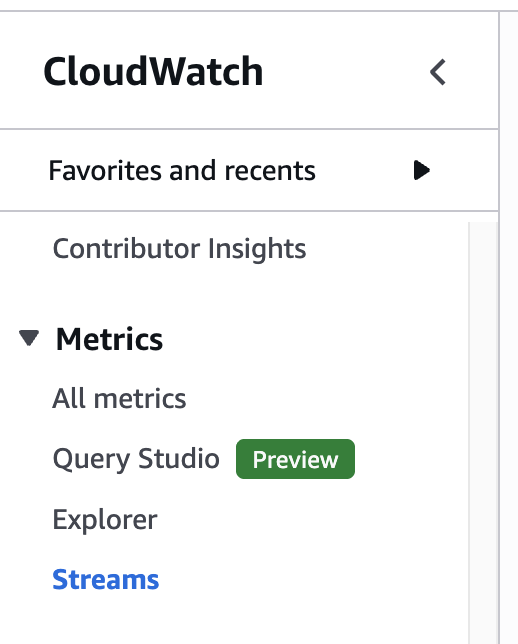
In the CloudWatch console, go to **Metrics → Streams**, then choose **Create metric stream**.
## Step 2 — Configure the Bronto HTTP endpoint
Configure the HTTP endpoint destination:
| Setting | Value |
| ----------------- | -------------------------------------------------- |
| HTTP endpoint URL | `https://ingestion..bronto.io/aws/metrics` |
| Access key | A Bronto API key with the ingestion role |
| Content encoding | **GZIP** |
Replace `` with `eu` or `us`. For example, use `https://ingestion.eu.bronto.io/aws/metrics` for the EU environment or `https://ingestion.us.bronto.io/aws/metrics` for the US environment. Do not use the direct OTLP `/v1/metrics` endpoint for this Firehose workflow.
Optionally, add `x-bronto-tags` in the destination's **Parameters** section to attach comma-separated tags to the ingested metrics, for example `environment=staging,region=eu-west-1`.
Let Firehose create a service role, or select an existing role with the permissions required to deliver to the HTTP endpoint. See AWS's [HTTP endpoint destination settings](https://docs.aws.amazon.com/firehose/latest/dev/create-destination.html) for further reading.
## Step 3 — Create a CloudWatch metric stream
In the CloudWatch console, go to **Metrics → Streams**, then choose **Create metric stream**.
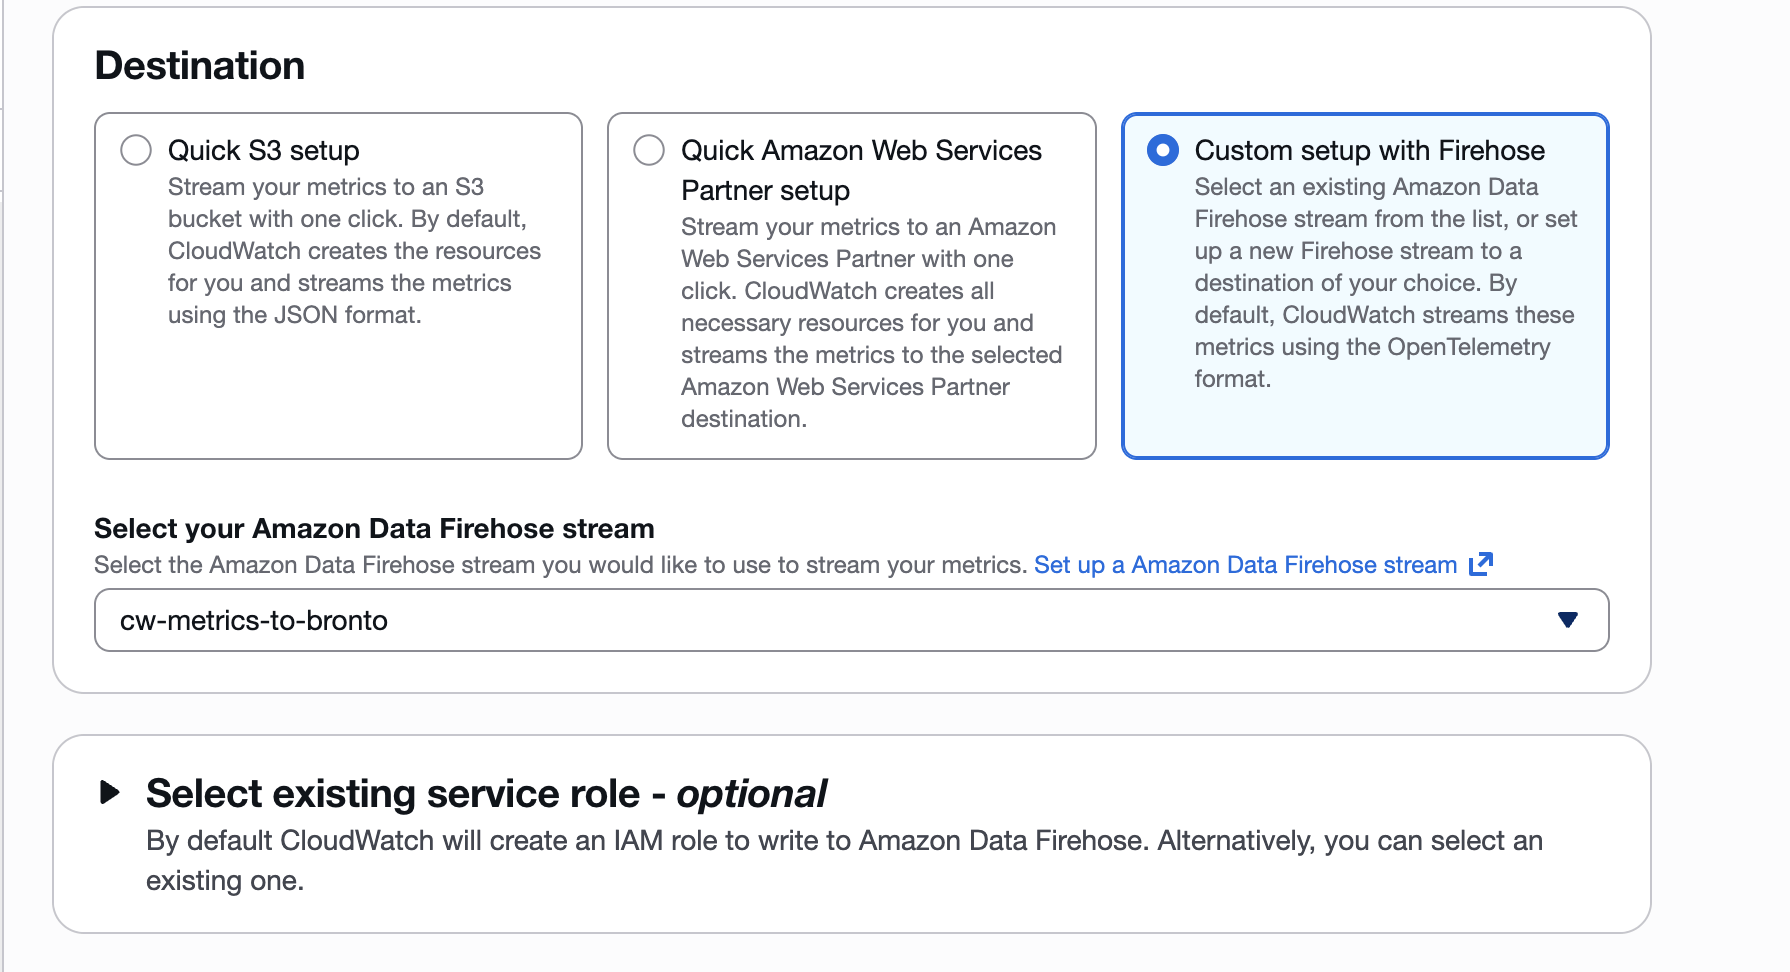
 Choose **Custom setup with Firehose**, select the Firehose delivery stream created in Step 1, and let CloudWatch create a service role or select an existing role that can write to the stream.
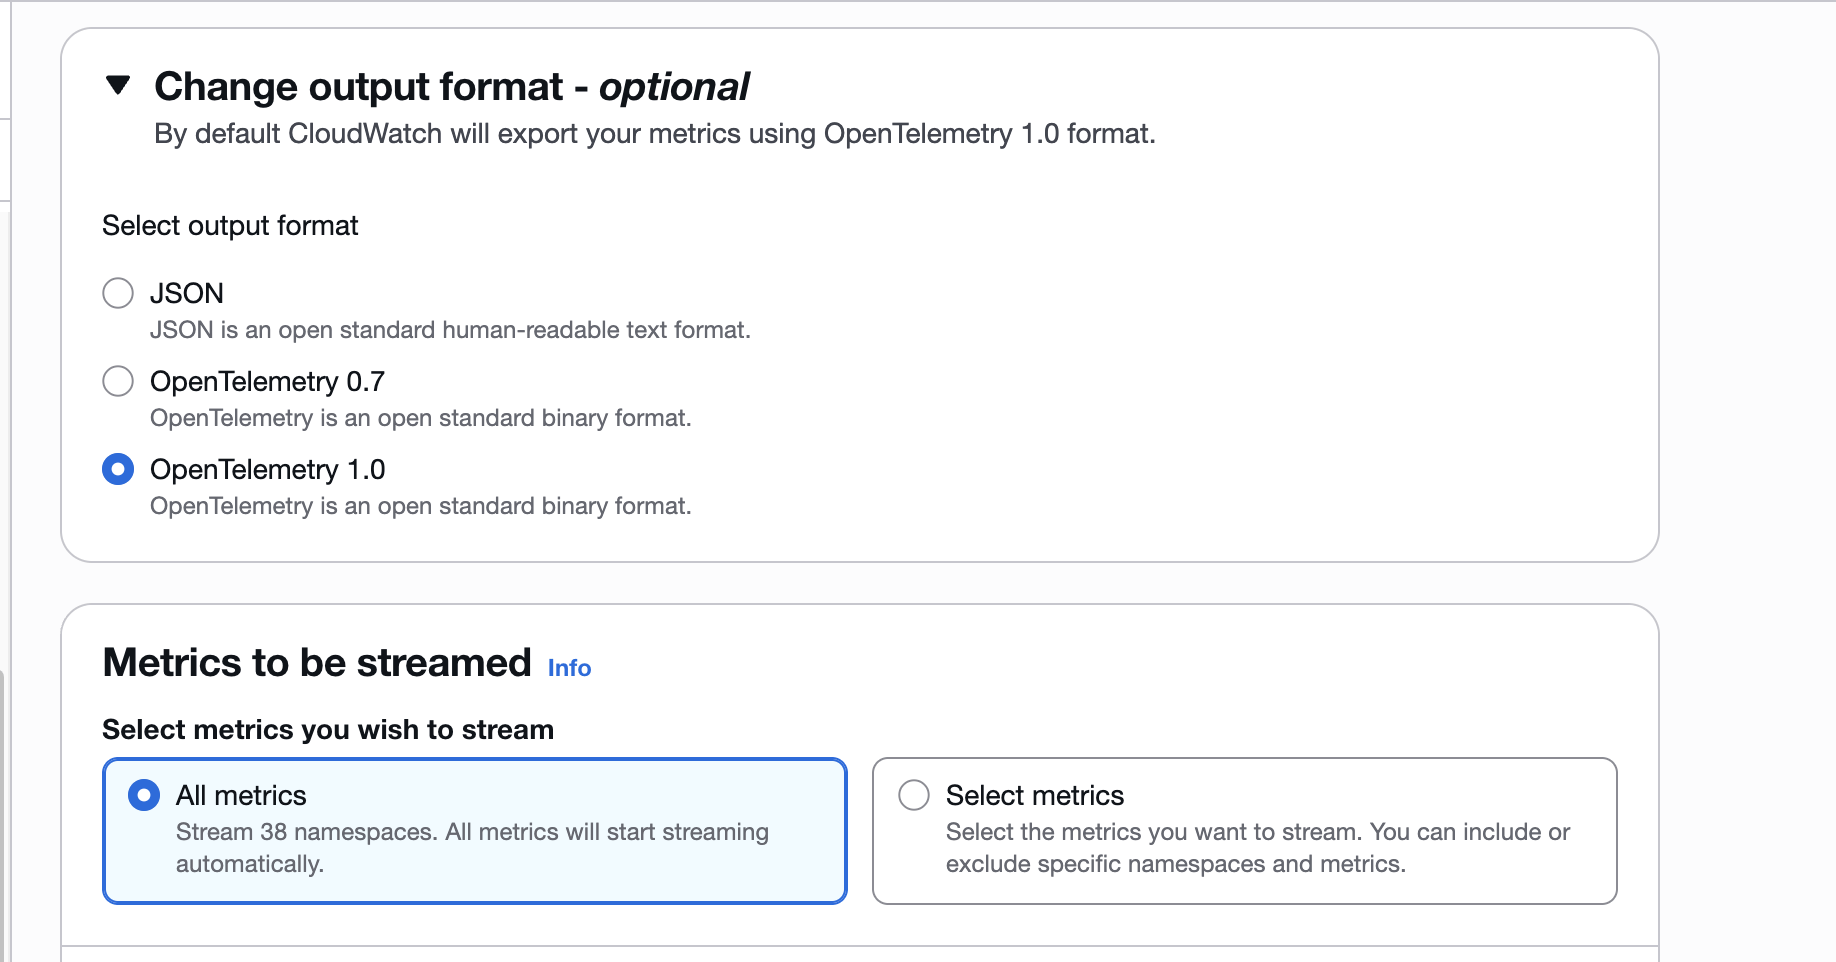
 Set the output format to **OpenTelemetry 1.0**. Choose **All metrics** or select only the metric namespaces and metrics you want to send. In a CloudWatch monitoring account, you can also choose to include metrics from linked source accounts. This option applies to the Region in which you create the stream.
CloudWatch Metric Streams always include the `Minimum`, `Maximum`, `SampleCount`, and `Sum` statistics. Additional statistics can be configured in CloudWatch at additional cost.
CloudWatch charges per metric update streamed, and Firehose charges for the data it processes. Streaming all metrics can be expensive in accounts with many metrics. Select only the namespaces you need when practical.
Set the output format to **OpenTelemetry 1.0**. Choose **All metrics** or select only the metric namespaces and metrics you want to send. In a CloudWatch monitoring account, you can also choose to include metrics from linked source accounts. This option applies to the Region in which you create the stream.
CloudWatch Metric Streams always include the `Minimum`, `Maximum`, `SampleCount`, and `Sum` statistics. Additional statistics can be configured in CloudWatch at additional cost.
CloudWatch charges per metric update streamed, and Firehose charges for the data it processes. Streaming all metrics can be expensive in accounts with many metrics. Select only the namespaces you need when practical.
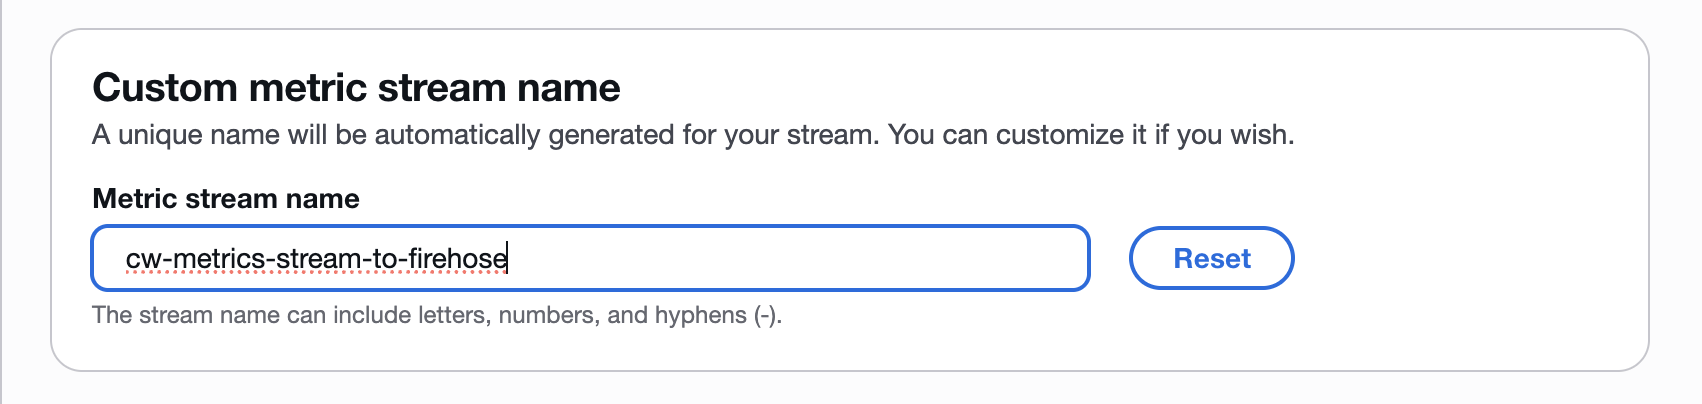
 Enter a metric stream name and create the stream. `cw-metrics-stream-to-firehose` is a suggested name only; it is not required.
 For AWS's complete setup instructions, including IAM and infrastructure-as-code options, see [Custom setup with Firehose](https://docs.aws.amazon.com/AmazonCloudWatch/latest/monitoring/CloudWatch-metric-streams-setup-datalake.html).
## Automate with AWS CloudFormation
Use the [Bronto CloudWatch Metrics deployment package](https://github.com/bronto-community/bronto-cloudwatch-metrics) to create and update filtered metric streams across multiple AWS accounts and Regions.
For each configured target, the package creates the CloudWatch Metric Stream, encrypted Firehose delivery stream and failure-backup bucket, CloudWatch delivery logs, and required IAM roles. It supports AWS CLI profiles that use direct credentials or assume roles into target accounts, and resolves the Bronto API key from AWS Secrets Manager without reading or copying it into the deployment script.
See the repository's [README](https://github.com/bronto-community/bronto-cloudwatch-metrics#readme) for prerequisites, configuration options, example targets, filtering, dry-run deployments, linked-account metrics, retention settings, and guidance for larger AWS Organizations environments.
## Verify metric ingestion
After the selected CloudWatch namespaces emit data, open **Metric Explorer** in Bronto and select a recently emitted AWS metric. Confirm that its timestamp, dimensions, and optional `x-bronto-tags` values are present. Allow for the Firehose buffering interval before troubleshooting delivery.
If delivery fails, open the `/aws/kinesisfirehose/` log group in CloudWatch Logs and inspect the `HttpEndpointDelivery` stream. Firehose records the HTTP response code and Bronto response details there. A valid Firehose endpoint response must use HTTP `200`, contain an uncompressed `application/json` body, and return the request's `requestId` with a numeric `timestamp`. See [HTTP endpoint request and response specifications](https://docs.aws.amazon.com/firehose/latest/dev/httpdeliveryrequestresponse.html) and [HTTP endpoint troubleshooting](https://docs.aws.amazon.com/firehose/latest/dev/http_troubleshooting.html).
For supported metric types, current limitations, direct OTLP configuration, and links to the upstream OpenTelemetry documentation, see [Send Metrics](/metrics/send-metrics).
## Further reading
* [Amazon CloudWatch metrics](./aws-cloudwatch-metrics)
* [Amazon CloudWatch Metric Streams](https://docs.aws.amazon.com/AmazonCloudWatch/latest/monitoring/CloudWatch-Metric-Streams.html)
* [Custom setup with Firehose](https://docs.aws.amazon.com/AmazonCloudWatch/latest/monitoring/CloudWatch-metric-streams-setup-datalake.html)
* [OpenTelemetry metrics concepts](https://opentelemetry.io/docs/concepts/signals/metrics/)
* [Send Metrics to Bronto](/metrics/send-metrics)
***
For assistance, contact [support@bronto.io](mailto:support@bronto.io).
For AWS's complete setup instructions, including IAM and infrastructure-as-code options, see [Custom setup with Firehose](https://docs.aws.amazon.com/AmazonCloudWatch/latest/monitoring/CloudWatch-metric-streams-setup-datalake.html).
## Automate with AWS CloudFormation
Use the [Bronto CloudWatch Metrics deployment package](https://github.com/bronto-community/bronto-cloudwatch-metrics) to create and update filtered metric streams across multiple AWS accounts and Regions.
For each configured target, the package creates the CloudWatch Metric Stream, encrypted Firehose delivery stream and failure-backup bucket, CloudWatch delivery logs, and required IAM roles. It supports AWS CLI profiles that use direct credentials or assume roles into target accounts, and resolves the Bronto API key from AWS Secrets Manager without reading or copying it into the deployment script.
See the repository's [README](https://github.com/bronto-community/bronto-cloudwatch-metrics#readme) for prerequisites, configuration options, example targets, filtering, dry-run deployments, linked-account metrics, retention settings, and guidance for larger AWS Organizations environments.
## Verify metric ingestion
After the selected CloudWatch namespaces emit data, open **Metric Explorer** in Bronto and select a recently emitted AWS metric. Confirm that its timestamp, dimensions, and optional `x-bronto-tags` values are present. Allow for the Firehose buffering interval before troubleshooting delivery.
If delivery fails, open the `/aws/kinesisfirehose/` log group in CloudWatch Logs and inspect the `HttpEndpointDelivery` stream. Firehose records the HTTP response code and Bronto response details there. A valid Firehose endpoint response must use HTTP `200`, contain an uncompressed `application/json` body, and return the request's `requestId` with a numeric `timestamp`. See [HTTP endpoint request and response specifications](https://docs.aws.amazon.com/firehose/latest/dev/httpdeliveryrequestresponse.html) and [HTTP endpoint troubleshooting](https://docs.aws.amazon.com/firehose/latest/dev/http_troubleshooting.html).
For supported metric types, current limitations, direct OTLP configuration, and links to the upstream OpenTelemetry documentation, see [Send Metrics](/metrics/send-metrics).
## Further reading
* [Amazon CloudWatch metrics](./aws-cloudwatch-metrics)
* [Amazon CloudWatch Metric Streams](https://docs.aws.amazon.com/AmazonCloudWatch/latest/monitoring/CloudWatch-Metric-Streams.html)
* [Custom setup with Firehose](https://docs.aws.amazon.com/AmazonCloudWatch/latest/monitoring/CloudWatch-metric-streams-setup-datalake.html)
* [OpenTelemetry metrics concepts](https://opentelemetry.io/docs/concepts/signals/metrics/)
* [Send Metrics to Bronto](/metrics/send-metrics)
***
For assistance, contact [support@bronto.io](mailto:support@bronto.io).