> ## Documentation Index
> Fetch the complete documentation index at: https://docs.bronto.io/llms.txt
> Use this file to discover all available pages before exploring further.
# Try Bronto with the OpenTelemetry Demo
> Run the OpenTelemetry Demo (Astronomy Shop) locally and route its logs and traces to Bronto to explore real, correlated telemetry without needing your own app.
The [OpenTelemetry Demo](https://opentelemetry.io/docs/demo/) — the "Astronomy Shop" — is a microservices application maintained by the OpenTelemetry project. It runs around 20 services written in different languages, emits logs, traces, and metrics, and ships a built-in load generator that keeps realistic traffic flowing. It's the fastest way to see what Bronto looks like with real, correlated data when you don't yet have your own application instrumented.
Because every service in the demo already exports to a bundled **OpenTelemetry Collector**, "trying Bronto" mostly means adding a Bronto exporter to a configuration you don't have to write yourself.
## What you'll see
Once data is flowing, Bronto will show:
* **Traces** spanning the full checkout flow across services (frontend → cart → checkout → payment → shipping, and more).
* **Logs** automatically correlated to those traces via `trace_id`, so you can jump from a log line to the request that produced it.
* A `service.name` per microservice, mapped directly to a Bronto Dataset with no extra configuration.
Bronto ingests **logs and traces** over OTLP. The demo also produces metrics, which it sends to its own Prometheus instance — those stay inside the demo and are not forwarded to Bronto.
## Prerequisites
* A Bronto API key — see [API Keys](/Account-Management/API-Keys) to create one.
* Your Bronto region (`eu` or `us`). The examples below use the EU endpoints; swap in `us` if that's your region. See [Ingestion Endpoints](/getting-started/bronto-endpoints).
* Either **Docker** (with Docker Compose) or a **Kubernetes** cluster with **Helm**.
## Step 1 — Get the demo
```bash Docker Compose theme={"dark"}
git clone https://github.com/open-telemetry/opentelemetry-demo.git
cd opentelemetry-demo
```
```bash Helm theme={"dark"}
helm repo add open-telemetry https://open-telemetry.github.io/opentelemetry-helm-charts
helm repo update
```
## Step 2 — Add Bronto as an exporter
The demo's Collector is designed to be extended. You add a Bronto `otlphttp` exporter and append it to the existing **traces** and **logs** pipelines.
The OpenTelemetry Collector merges config files but **replaces** lists rather than appending to them. When you redefine a pipeline's `exporters`, you must repeat the demo's upstream exporters so they keep working alongside Bronto.
The demo provides a dedicated, normally-empty extension file for exactly this purpose. Edit `src/otel-collector/otelcol-config-extras.yml`:
```yaml src/otel-collector/otelcol-config-extras.yml theme={"dark"}
exporters:
otlphttp/bronto:
logs_endpoint: https://ingestion.eu.bronto.io/v1/logs
traces_endpoint: https://ingestion.eu.bronto.io/v1/traces
compression: none
headers:
x-bronto-api-key:
service:
pipelines:
traces:
# repeat the upstream exporters, then add Bronto
exporters: [otlp_grpc/jaeger, debug, span_metrics, otlphttp/bronto]
logs:
exporters: [opensearch, debug, otlphttp/bronto]
```
Replace `` with your key and adjust the region in both endpoints if you're on US.
The upstream exporter names above (`otlp_grpc/jaeger`, `span_metrics`, `opensearch`, …) are listed in the comments at the top of `otelcol-config-extras.yml`. If a future version of the demo changes them, copy the current names from that file so you don't drop the demo's own backends.
Override the bundled Collector config through the chart's values. Create `bronto-values.yaml`:
```yaml bronto-values.yaml theme={"dark"}
opentelemetry-collector:
config:
exporters:
otlphttp/bronto:
logs_endpoint: https://ingestion.eu.bronto.io/v1/logs
traces_endpoint: https://ingestion.eu.bronto.io/v1/traces
compression: none
headers:
x-bronto-api-key:
service:
pipelines:
traces:
# repeat the upstream exporters, then add Bronto
exporters: [otlp, debug, spanmetrics, otlphttp/bronto]
logs:
exporters: [opensearch, debug, otlphttp/bronto]
```
The same list-replace rule applies: include the chart's existing exporters for each pipeline. Inspect the rendered defaults with `helm show values open-telemetry/opentelemetry-demo` if you're unsure of the current names.
Avoid committing your API key. Reference a Kubernetes Secret instead, or pass the key with `--set 'opentelemetry-collector.config.exporters.otlphttp/bronto.headers.x-bronto-api-key='` at install time.
## Step 3 — Start the demo
```bash theme={"dark"}
docker compose up --force-recreate --remove-orphans --detach
```
The web store is available at [http://localhost:8080](http://localhost:8080). The built-in load generator starts producing traffic automatically, so telemetry begins flowing without any manual clicks.
```bash theme={"dark"}
helm install my-otel-demo open-telemetry/opentelemetry-demo --values bronto-values.yaml
```
Follow the chart's output notes to port-forward the frontend proxy. The load generator runs in-cluster and starts traffic on its own.
## Step 4 — Explore your data in Bronto
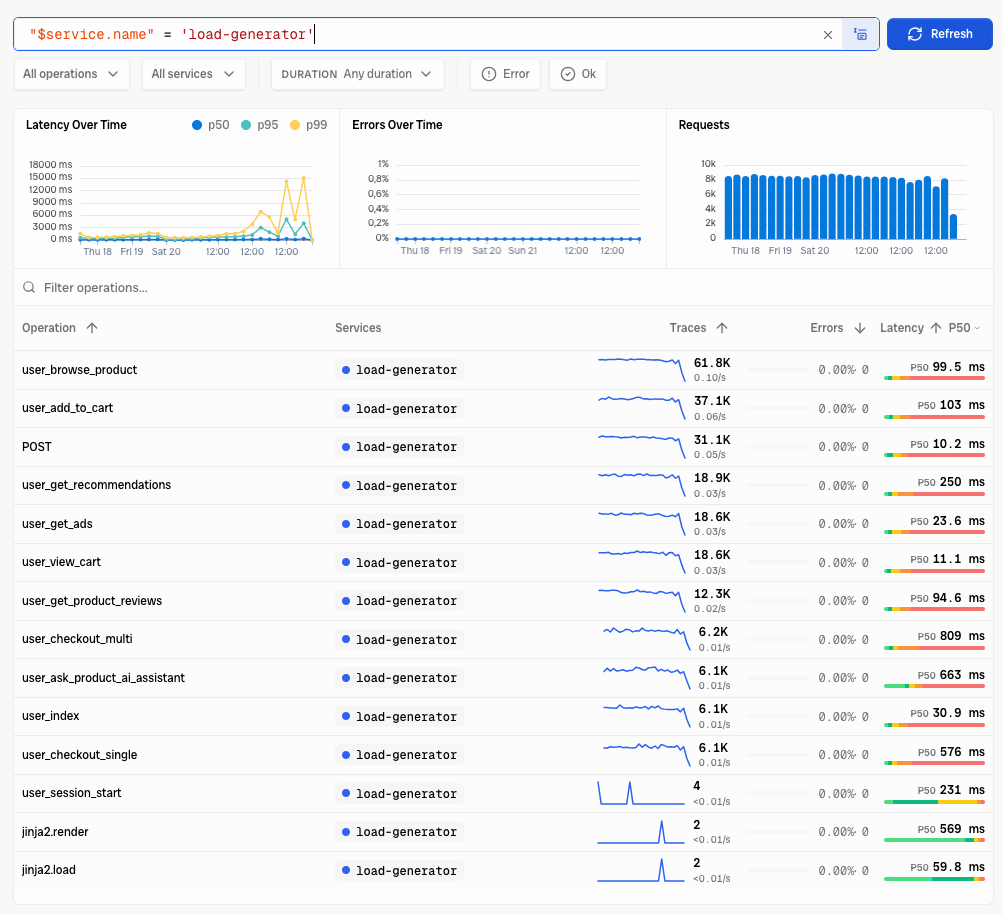
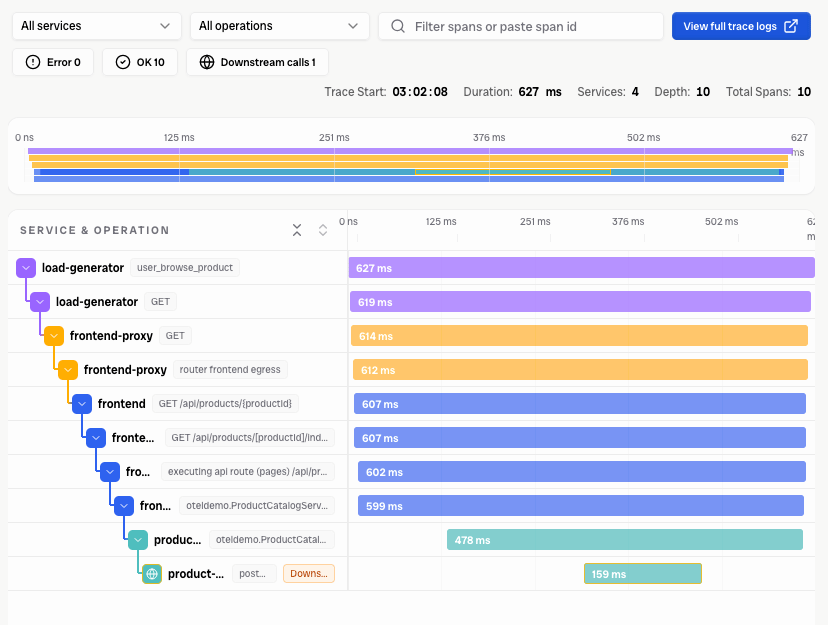
Within a minute or two, telemetry should appear in Bronto. Here are two quick things to try.
Open [Explore Traces](/tracing/explore-traces) and pick a recent trace from the `frontend` service. Expand the spans to watch a single checkout request fan out across cart, currency, payment, and shipping. Click a span's `trace_id` to pivot into the correlated logs for that exact request.
 Create a simple [dashboard](/Search-and-Visualize/Dashboards) — for example, log volume broken down by `service.name`, or error count over time. Because each demo service maps to its own Dataset, you'll immediately see the shape of a real multi-service system.
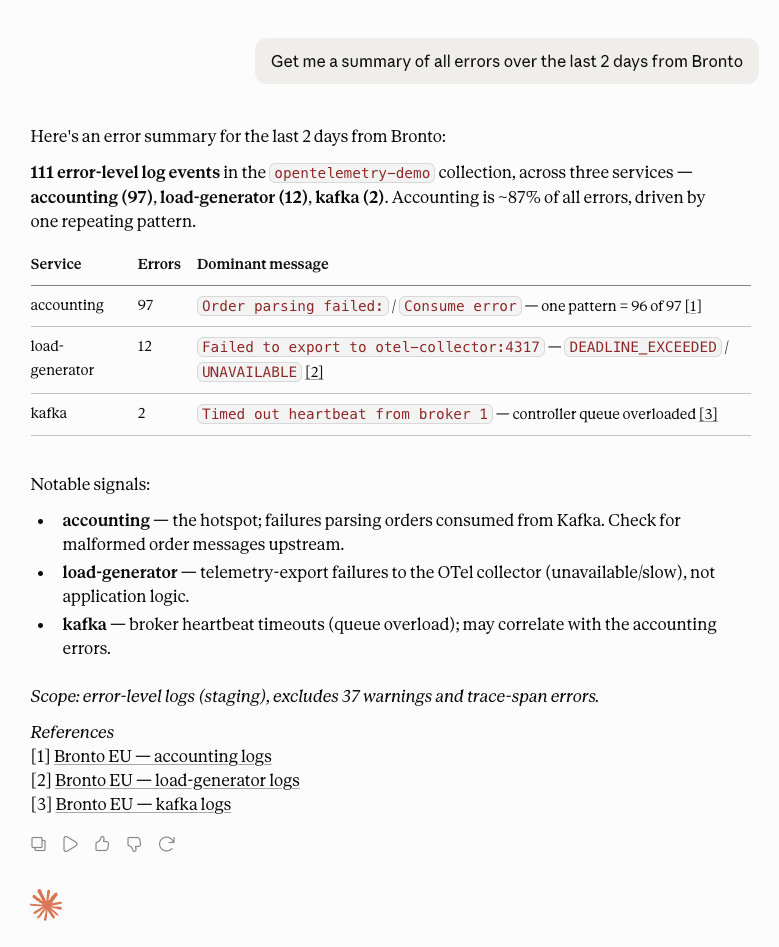
Connect the [Bronto MCP server](/ai-features/hosted-mcp) to your AI assistant and query the demo data in plain language — no query syntax required. Ask for an error summary, a latency outlier, or which service is failing, and let the assistant investigate across the demo's logs and traces.
Create a simple [dashboard](/Search-and-Visualize/Dashboards) — for example, log volume broken down by `service.name`, or error count over time. Because each demo service maps to its own Dataset, you'll immediately see the shape of a real multi-service system.
Connect the [Bronto MCP server](/ai-features/hosted-mcp) to your AI assistant and query the demo data in plain language — no query syntax required. Ask for an error summary, a latency outlier, or which service is failing, and let the assistant investigate across the demo's logs and traces.
 Want to generate errors on demand? The demo includes a feature-flag service that can inject failures (such as a failing payment or cart service). Toggling those flags is a good way to see how problems surface in Bronto's traces and logs.
## Troubleshooting
If data doesn't appear:
* Confirm the endpoints match your region (`eu` vs `us`) and end in `/v1/logs` and `/v1/traces`.
* Confirm the `x-bronto-api-key` header is present and the key is valid.
* Confirm you repeated the demo's existing exporters in each pipeline — a typo there can silently drop the whole pipeline.
* Check the Collector logs (`docker compose logs otel-collector`, or the collector pod) for export errors.
## Next steps
Once the demo makes sense, point your own application's OTLP traces at Bronto.
Use the language guides to add OpenTelemetry logs and traces to your services.
Want to generate errors on demand? The demo includes a feature-flag service that can inject failures (such as a failing payment or cart service). Toggling those flags is a good way to see how problems surface in Bronto's traces and logs.
## Troubleshooting
If data doesn't appear:
* Confirm the endpoints match your region (`eu` vs `us`) and end in `/v1/logs` and `/v1/traces`.
* Confirm the `x-bronto-api-key` header is present and the key is valid.
* Confirm you repeated the demo's existing exporters in each pipeline — a typo there can silently drop the whole pipeline.
* Check the Collector logs (`docker compose logs otel-collector`, or the collector pod) for export errors.
## Next steps
Once the demo makes sense, point your own application's OTLP traces at Bronto.
Use the language guides to add OpenTelemetry logs and traces to your services.